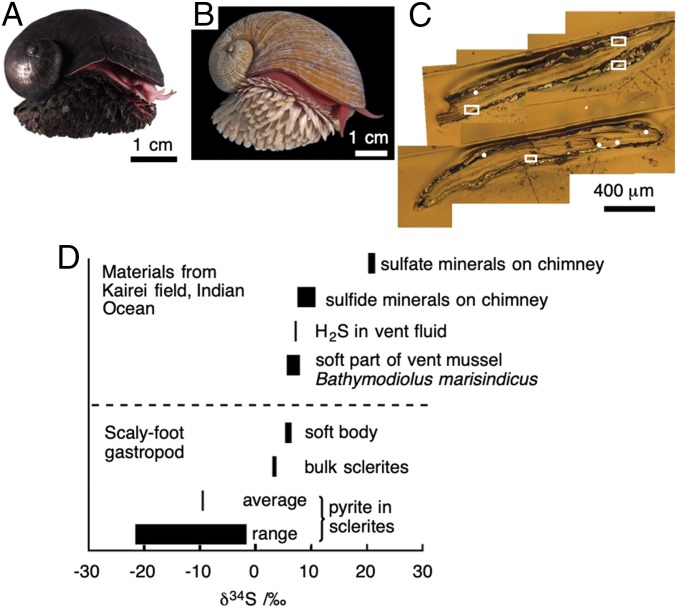
Fig. 1.
Nano-SIMS imaging of black scaly-foot scales. (A) Black scaly-foot snail. (B) White scaly-foot snail. (C) Optical micrograph of the cross-section of black scaly-foot scale. White dots and squares are analyzed areas; the detailed data are shown in SI Appendix, Fig. S2. (D) Summary of δ34S in comparison with surrounding environments.

