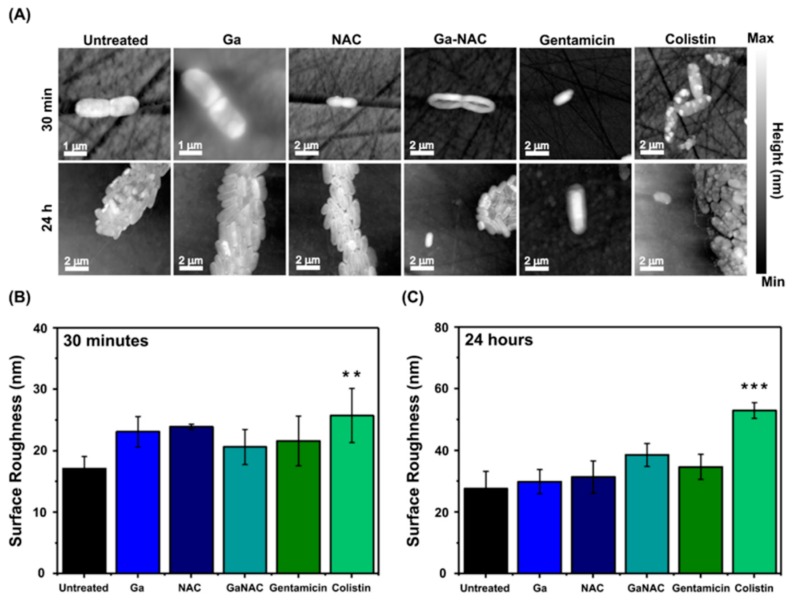
Figure 8.
AFM with RMS surface roughness analysis of PAO1 after treatment with Ga formulations. (A) Representative AFM height images of bacteria under different treatment conditions at 30 min and 24 h used for measuring RMS surface roughness, (B) RMS surface roughness of bacteria after 30 min with the various treatment components showing significant cell membrane roughening with Colistin, and (C) RMS surface roughness measurements of treated bacteria after 24 h demonstrating more advanced significant cell membrane roughening by Colistin (** p ≤ 0.01, *** p ≤ 0.001).

