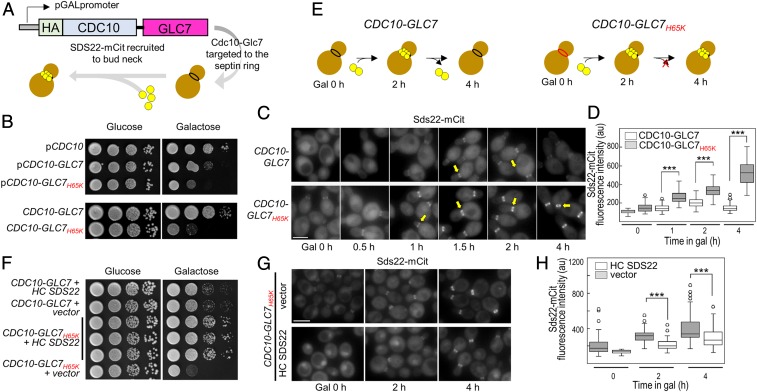
Fig. 5.
In yeast, SDS22 and PP1 form a constitutive complex when the M1-metal coordination site is disrupted. (A) Model of the system: HA-CDC10-GLC7 chimera was placed under the transcriptional control of the GAL1 promoter. A flexible linker was introduced between the 3′ end of CDC10 and the 5′ end of GLC7 coding sequences to allow the fused proteins to adopt their native conformations. Upon induction, mCit-tagged Glc7 regulators (i.e., Sds22) are visualized at the bud neck. (B, Top) A WT strain (KT2762) was transformed with the designated plasmids. Transformants were serially diluted onto selective media lacking tryptophan, containing either glucose or galactose, and plates were imaged after incubation for 40–44 h at 24 °C. (B, Bottom): CDC10-GLC7WT (KT4038) and CDC10-GLC7H65K (KT2947) cells were serially diluted as in the Top (mammalian and bacterial PP1 residue numbers differ by −1). (C) Sds22-mCit was imaged in CDC10-GLC7 (KT4022 × KT4023) and CDC10-GLC7H65K (KT4020 × KT4021) cells grown in galactose for the indicated times. (Scale bar, 5 µm.) (D) Quantitative analysis of Sds22-mCit fluorescence in cells imaged in C. P values were calculated by two-tailed t test (***P < 0.001). (E) Cartoon model illustrating transient Sds22 association at the bud neck with Cdc10-Glc7 (Left) and the constitutive association of Sds22 with Cdc10-Glc7H65K (Right). (F) A WT strain (KT2764) was cotransformed with plasmids as indicated. Transformants were serially diluted onto selective media for both plasmids containing either glucose or galactose, and plates were imaged after incubation for 40–44 h at 24 °C. Three different transformants expressing CDC10-GLC7H65K and overexpressing SDS22 are shown (rows 3–5). (G) A Sds22-mCit strain (KT2764) was cotransformed with a plasmid containing CDC10-GLC7H65K and either the empty vector (Top) or a plasmid containing SDS22 that replicates to high copy number (HC SDS22; Bottom). Transformants were grown to logarithmic phase in selective media for both plasmids, and Sds22-mCit was imaged after addition of galactose for the indicated times. (Scale bar, 5 µm.) (H) Quantitative analysis of Sds22-mCit fluorescence at the bud neck in strains imaged in G (n = 100). P values were calculated by two-tailed t test (***P < 0.001).

