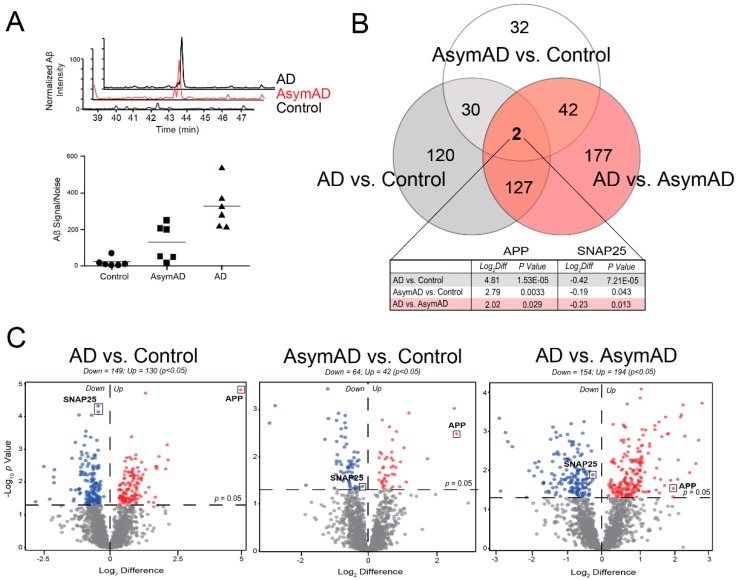
Figure 2.
Differential Protein Abundance Across Disease Stages. (A) The top graph depicts extracted ion chromatograms for a fully tryptic amyloid precursor protein (APP) peptide corresponding to residues 17–28 of the Aβ sequence (LVFFAEDVGSNK) in a representative control, Asymptomatic Alzheimer’s Disease (AsymAD) and Alzheimer’s disease (AD) case. Signals were normalized by setting the maximum signal intensity of the AD sample to 100%. The bottom graph demonstrates the normalized peptide intensity of this Aβ sequence in all 18 cases. As expected, this measurement increased incrementally from control to AsymAD to AD cases. (B) Venn diagram for the 530 proteins significantly altered (p < 0.05) among the three pairwise comparisons, i.e., AD vs. Control, AsymAD vs. Control, and AD vs. AsymAD. APP and the synaptic protein SNAP25 were the only two proteins to demonstrate significant changes in all pairwise comparisons. (C) Volcano plots display the log-transformed fold change (Log2 Difference) against the log-transformed Tukey-adjusted ANOVA p value (−Log10 p Value) for all proteins of each pairwise comparison. Those proteins with significantly decreased expression (p < 0.05) for each comparison are shown in blue, while the proteins with significantly increased expression (p < 0.05) are noted in red. Abbreviations: AD, Alzheimer’s disease; AsymAD, Asymptomatic Alzheimer’s Disease; Log2Diff, Log2 Difference (i.e., Log2 Fold Change).

