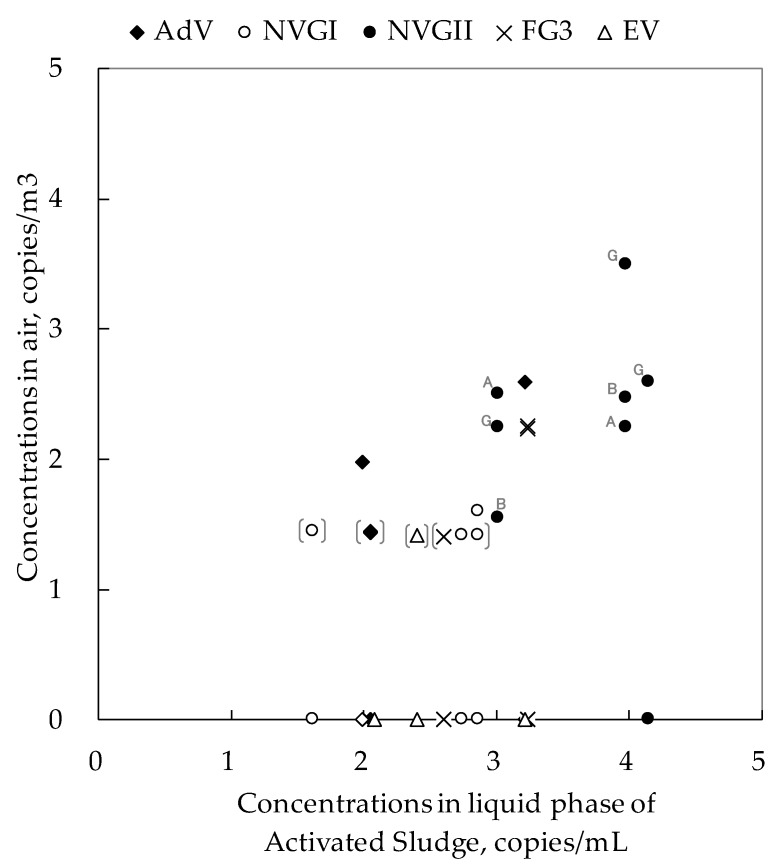
Figure 4.
Correlations between virus concentration in activated sludge (liquid phase) and in the air. Notes: The plots on the horizontal axis represent samples not detected. [ ]: Under the quantification limit (detected but not quantified; the plot gives the detection limit value). NV GI; Norovirus genogroup I, NV GII; Norovirus genogroup II, AdV; Adenovirus (all serotypes), FG3; F+-specific RNA coliphage serotype 3.

