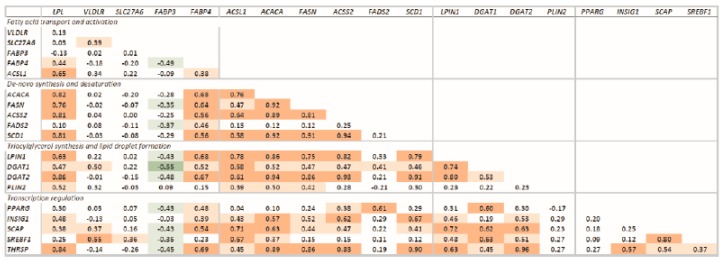
Figure 5.
Correlations of the transcription of measured genes. Significant correlations are denoted by bold font and red (positive correlation; p < 0.0001), light red (positive correlation: p < 0.05), green (negative correlation; p < 0.0001), and light green (negative correlation: p < 0.05). Transcripts were grouped based on function.

