Fig. 1.
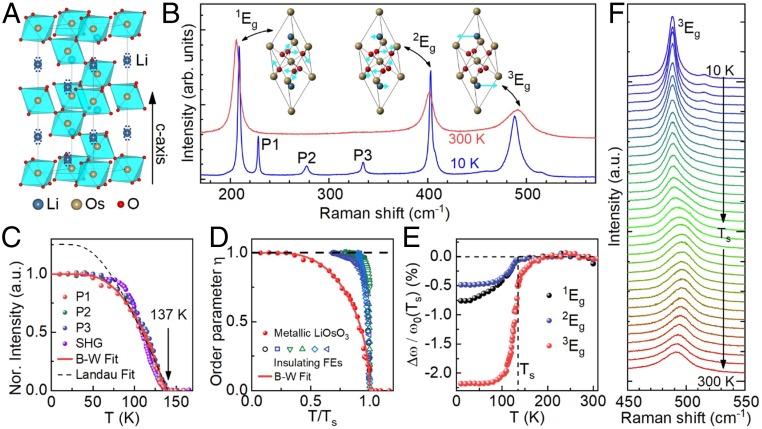
(A) The centrosymmetric crystal structure of LiOsO3 with possible polar deviation from central symmetric position of Li atoms along the c axis (dashed circles). (B) Raman spectra of LiOsO3 at 10 K and 300 K. The vibrational patterns of 3 Eg modes are shown in Insets. (C) T dependence of the normalized Raman intensities of P1, P2, and P3 modes compared with the absolute SHG signal (16). (D) The order parameter of the phase transition in LiOsO3 compared with that of other typical insulating FEs (see main text). (E) Relative Raman shift of 1Eg, 2Eg, and 3Eg after subtracting the ordinary T-dependent phonon frequency. The red solid curves in (C) and (D) represent the fitting result to the Bragg−Williams formula. The black dashed curve in (C) shows the fitting result to the Landau formula, while the black dashed lines in (D) and (E) are guides for the eye. (F) T dependence of Raman spectra for the 3Eg mode.

