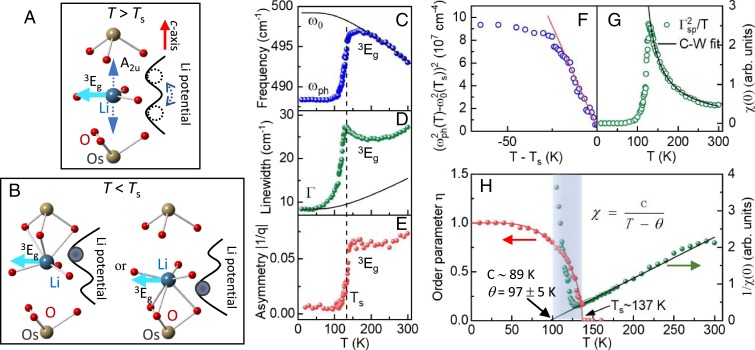
Fig. 2.
(A and B) The coordination environment of Li atoms with a schematic Li potential well diagram at (A) high-T and (B) low-T phases. (C−E) T dependence of the (C) frequency, (D) line width, and (E) asymmetry factor |1/q| of the 3Eg mode. The solid curves in C and D are the ordinary T-dependent phonon frequency and width without phase transition, and the dashed horizontal lines in (C−E) represent the transition temperature Ts. (F) T dependence of the second power of the squared 3Eg phonon shift below Ts. The solid curve is a linear fit to the data between 0 K and 18 K with an intercept of ∼0.36*107 cm−4. (G) T dependence of the dielectric susceptibility χ(0) calculated according to χ(0) ∝ Γ2sp/T. (H) Comparison of 1/χ(0) and the order parameter of LiOsO3. The black solid lines in (G) and (H) represent Curie−Weiss fits with Curie−Weiss temperature θ = 97 ± 5 K. The temperature range θ ≤ T ≤ Ts is highlighted in gray.

