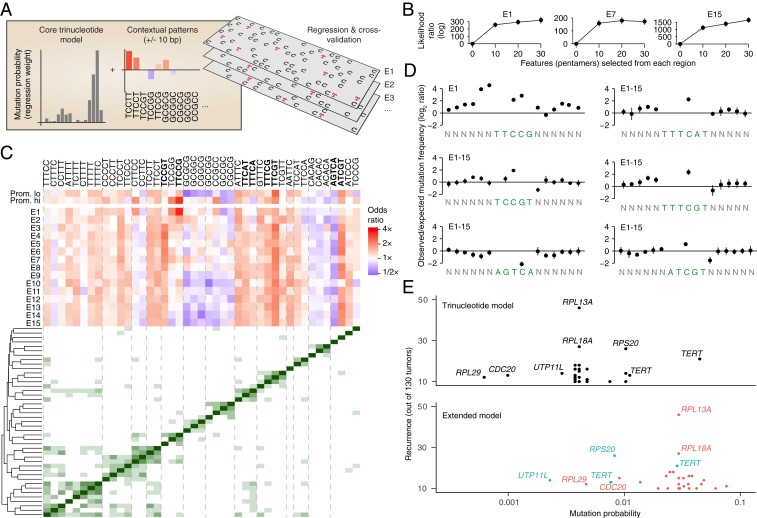
Fig. 5.
A regression-based signature model reveals extended patterns that are informative of UV mutagenesis in addition to trinucleotides. (A) UV mutations (C > T subset) were modeled using logistic regression, taking into account standard trinucleotide patterns as well as presence/absence of longer pentamer patterns occurring anywhere within ±10 bp of a given position. Signature models were built repeatedly for each the 15 ChromHMM regions as well promoters (high/low expression), based on 0.5 Mb randomly sampled positions from each region and using a common set of pentamer features (Materials and Methods). (B) Modeling of observed mutations is improved when long features are considered (all regions shown in SI Appendix, Fig. S4). Ten 0.5-Mb random subsets were evaluated for each region. Log likelihood ratios relative a standard trinucleotide model (zero long features) are shown (bars indicate SD). (C, Upper) Heatmap: influence (odds ratio) of different pentamer patterns on mutation probability (blue, stimulatory; red, attenuating) across interrogated regions. Pentamers with low regression weights were excluded for visualization, leaving 43/61 patterns included during feature selection (union of top 20 patterns from each ChromHMM region; Materials and Methods). (C, Lower) Distance matrix and clustering dendrogram: co-occurrence patterns linking pentamers together into longer motifs. Dashed lines delineate notable clusters. Bold mark patterns highlighted in D. (D) Positional distribution of mutations across select patterns from A (either individual pentamers or aggregated from multiple pentamers forming a longer consensus motif, as indicated by clustering). Frequencies were normalized to trinucleotide-based expectations given by the underlying sequences. (E) Probability of mutagenesis at promoter mutation hotspots (recurrent bases within 500 bp upstream of a TSS) in melanoma, as given by a simple trinucleotide model (Upper) or the extended model (trinucleotide core model plus longer patterns; Lower). Locally derived models from corresponding ChromHMM regions were used for all mutations. Recurrence is indicated on the y axis (n ≥ 10). Colors indicate whether probabilities are up (red) or down (blue) in the extended compared to the trinucleotide model.

