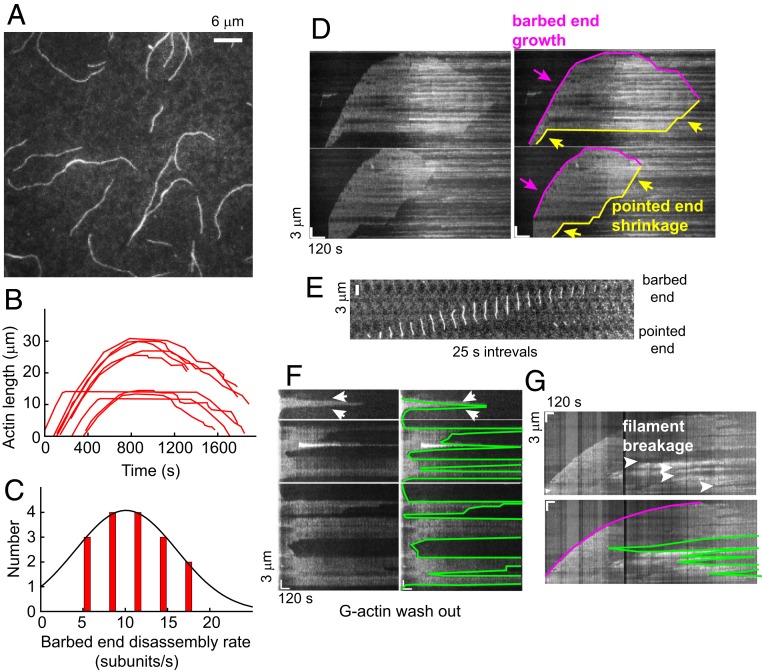
Fig. 2.
Dynamics of unstabilized PfAct1 filaments. (A) The 8 µM PfAct1 forms >10-µm-long filaments after 10 min in the absence of JAS. Filaments were visualized by TIRF microscopy using actin–chromobody Emerald (Movies S2–S4). (B) Time course of growth and shrinkage of PfAct1 barbed ends in 9 individual actin filaments. (C) Histogram of PfAct1 barbed-end disassembly rate during the depolymerization stage. The solid curve is a Gaussian fit to the data (11 ± 4 subunits/s). (D) Raw kymographs (Left), along with a skeletonized version of each (Right), illustrating growth of the barbed end, followed by a period of relatively constant length and then shrinkage at longer time (magenta). The pointed end (yellow) showed periods of shortening (sloped lines) interspersed with pauses (horizontal lines) where the length did not change. (E) Time-lapse (25-s intervals) of a filament in which pointed end depolymerization caught up with the growing barbed end resulting in filament dissolution. (F) Raw kymographs (Left), along with a skeletonized version of each (Right), showing actin filament breakage and depolymerization, sometimes from both ends (arrows), following removal of free G-actin monomers from the solution at the start of the kymograph (Left). (G) Raw kymograph (Upper) and a skeletonized version (Lower, magenta tracks the barbed end) illustrating multiple cleavage events along a filament and shrinkage of the cleaved filaments from both ends with time. Polymerization buffer: 10 mM imidazole, pH 7.5, 50 mM KCl, 2 mM MgCl2, 1 mM EGTA, 2.5 mM MgATP,10 mM DTT, 0.25% methylcellulose, 0.13 mg/mL glucose oxidase, 50 μg/mL catalase, and 3 mg/mL glucose.

