Fig. 5.
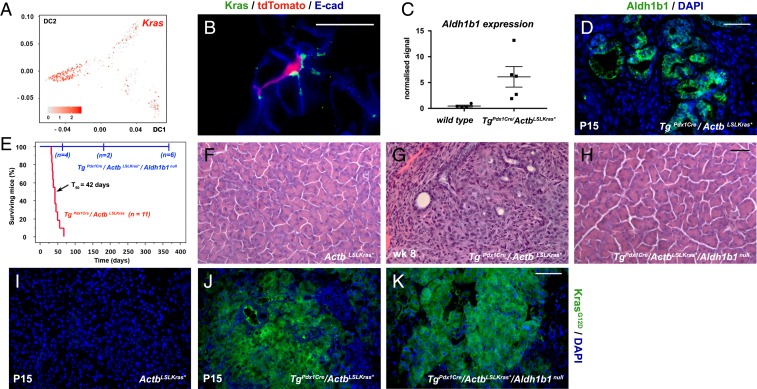
Aldh1b1 is strongly up-regulated in mouse PDAC and necessary for its initiation. (A) Kras is preferentially expressed in progenitor cells. Numbers on the axes represent diffusion coefficients and the values of the heat map correspond to the log10(normalized sequencing counts) values. (B) Immunofluorescence for Kras showed colocalization with tdTomato+ cells. (C and D) Aldh1b1 expression is dramatically up-regulated in the Pdx1Cre/ActbLSLKras* PDAC model at both the mRNA (microarray gene expression analysis) (C) and protein levels as detected by immunofluorescence (D). (E) Kaplan–Meier mouse survival curves showed that TgPdx1-Cre/ActbLSLKras* mice had a median survival rate (T50) of 42 d (red line). In contrast, Kras* was unable to exert its oncogenic action in TgPdx1Cre/ActbLSLKras*/Aldh1b1null mice (blue line) (log-rank P < 0.0001). From a cohort of 12 animals, 6 were killed at the time points indicated on the graph and histological analysis revealed that they were tumor- and PanIN-free. The remaining 6 animals were healthy and tumor-free until the age of 12 mo. (F–H) Normal pancreas morphology in ActbLSLKras* animals (F) and invasive PDAC in the Pdx1Cre/ActbLSLKras* PDAC model at P15 (G) which never appears in absence of functional Aldh1b1 (H). (I–K) Immunofluorescence showed that induction of Kras* (E and F) is not affected in the absence of Aldh1b1 (F). (Scale bars: 20 μm, B; 50 μm, D and F–H; 60 μm, I–K.) In C the mean (wide horizontal bar) and the SEM (narrow horizontal bar) are shown.

