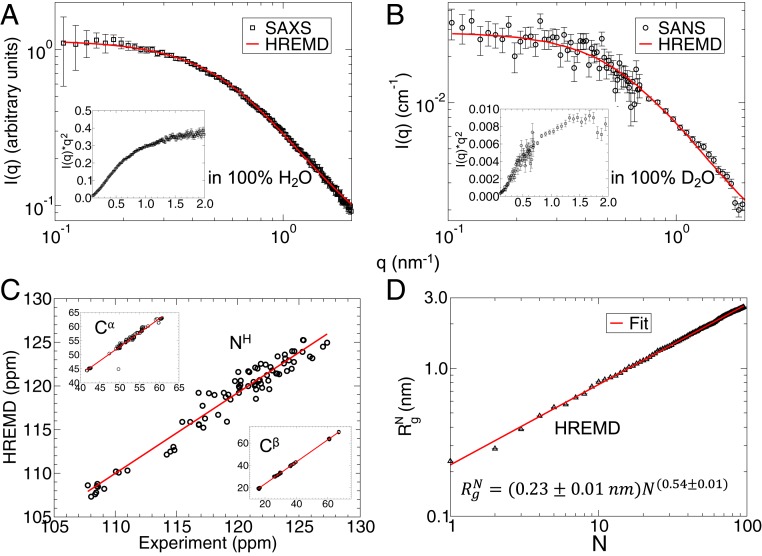
Fig. 1.
(A and B) Experimental (A) SAXS in 100% H2O and (B) SANS in 100% D2O profiles are shown in black squares and circles, respectively. Experimental Kratky plots, I(q) × q2 vs. q shown in the Insets confirm the unfolded structure of SH4UD. The ensemble-averaged profiles calculated from ∼510-ns HREMD trajectory are shown as a red line. (C) Comparison between experimental and calculated (HREMD) NMR chemical shifts, expressed in parts per million (ppm), of the backbone NH, Cα, and Cβ atoms. The NMR experimental data are taken from Biological Magnetic Resonance Data Bank entry 15563 (12) and the theoretical chemical shifts were calculated using SHIFTX2 from ∼51,000 structures (122). (D) Radius of gyration of a protein segment consisting of N residues calculated from the HREMD simulation. The red line is a fit of Eq. 1 to the data.

