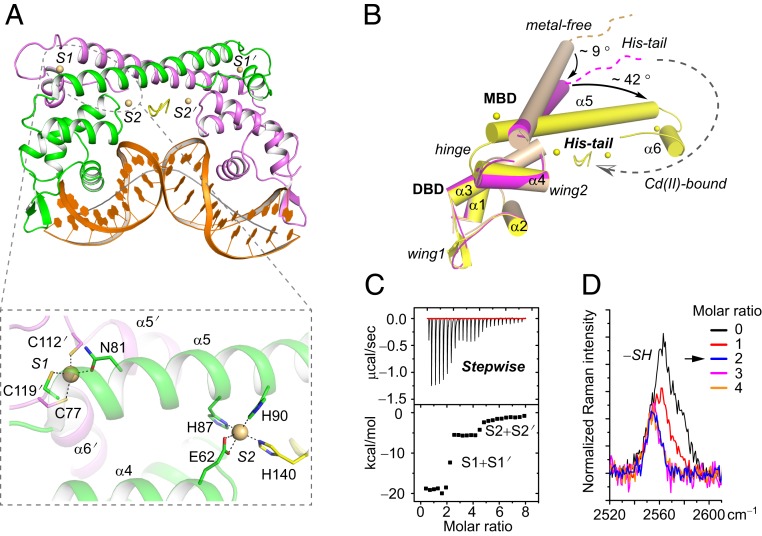
Fig. 1.
Two types of cadmium-binding sites and the allosteric effects triggered by cadmium binding. (A) Cartoon presentations of the Cd/CadR/DNA complex. DNA is colored in orange. The helical axis of DNA is represented as a solid gray line. Cadmium ions are shown as spheres. Close-up view of the first coordination shell of metal-binding sites is shown within the dashed box. (B) Superimposition of crystal structures based on the DBD of a CadR molecule of the metal-free CadR/DNA complex. For clarity, the partner CadR molecule and DNA are omitted. The 3 structures—apo-CadR, metal-free CadR/DNA complex, and Cd/CadR/DNA complex—are in wheat, magenta, and yellow, respectively. The allosteric movements triggered by cadmium binding are represented by dashed and solid arrows. (C) ITC curves showing that CadR has a clear, stepwise binding model toward the cadmium ion. (D) Raman peak of sulfhydryl group (∼2,563 cm−1) in CadR with a different molar ratio of Cd(II) ions.

