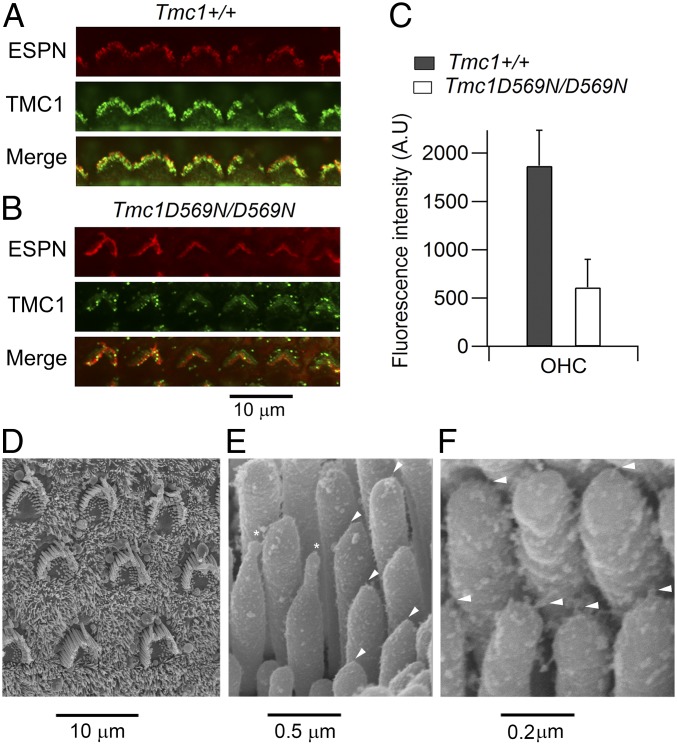
Fig. 3.
TMC1 expression and OHC bundle shape in the D569N mutant. (A) Immunolabeling for TMC1 in the apical region of a P7 Tmc1+/+; Tmc2−/− mouse cochlea. One row of OHCs is shown, the bundle structure (red fluorescence) revealed by an antibody against the actin cross-linker ESPN. (B) Immunolabeling in the apical region of a P7 Tmc1 p.D569N/D569N; Tmc2−/− mouse cochlea, showing reduced TMC1 expression. (C) Quantification of fluorescence (mean ± SD) evaluated form 24 OHCs in each of 2 mice of each strain. TMC1 label is reduced 3.1-fold from 1,870 to 611 counts (t test, P < 0.0001). (D) Scanning electron micrograph of apical OHC bundles in a P7 Tmc1 p.D569N/D569N; Tmc2−/− mouse cochlea. (E) Scanning electron micrograph of OHC stereocilia from P7 Tmc1 p.D569N/D569N; Tmc2−/− mouse cochlear apex; arrowheads indicate tip links, and asterisks denote 2 distorted stereocilia with unusual elongated tips. (F) Higher power of OHC stereocilia in Tmc1 p.D569N/D569N; Tmc2−/− mutant showing persistence of tip links (arrowheads).

