Fig. 5.
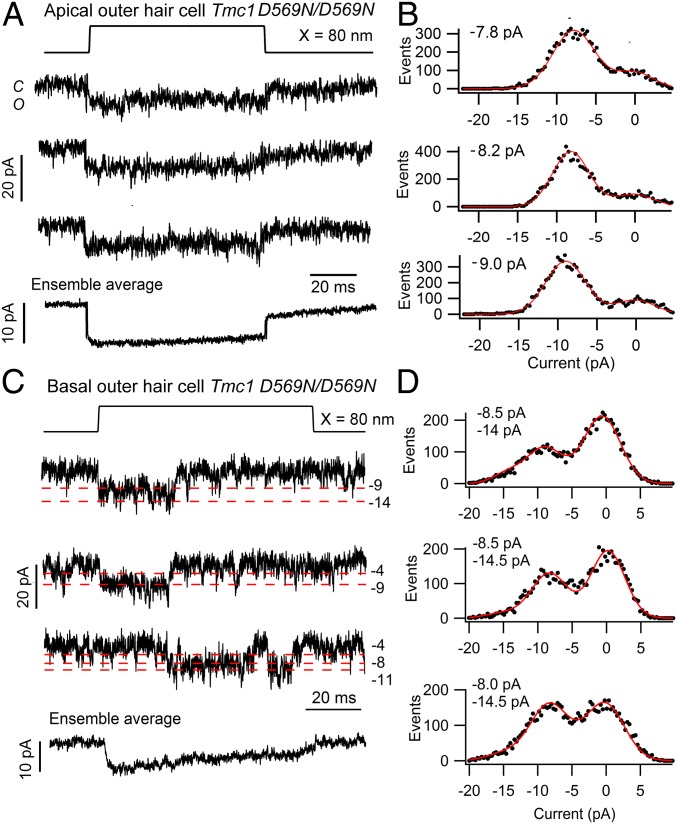
Single MET channel currents in apical and basal OHCs of Tmc1 pD569N/D569N; Tmc2−/− mice. (A) Three examples of single-channel records. (Bottom) The ensemble average current of 100 stimuli for a P5 apical OHC. (B) Amplitude histograms for each trace shown in A were fit with single Gaussians, giving channel amplitudes of −7.8, −8.2, and −9.0 pA. (C) Single-channel records and ensemble average of 30 presentations for a P4 basal OHC; red dashed lines indicate multiple current levels (pA). (D) Amplitude histograms for each trace shown in C were fit with single Gaussians, giving channel amplitudes of −8.5 and −14 pA; −8.5 and −14.5 pA; and −7.7 and −14.5 pA. The components at −14 or −14.5 pA were included in the fitting, but the other levels were too small to appear in the histograms. In both apical and basal hair cells, the extracellular Ca2+ around the bundle was 0.04 mM, and the holding potential was −84 mV.

