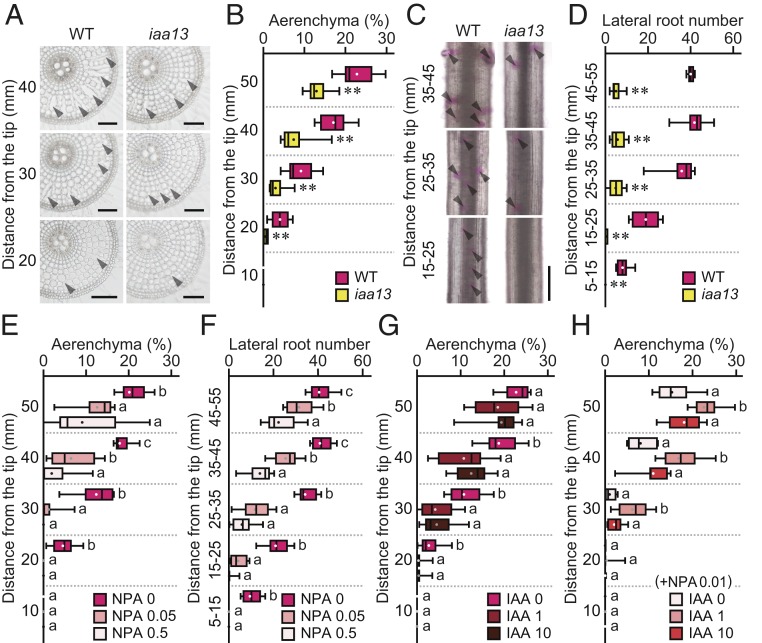
Fig. 1.
Analyses of aerenchyma and lateral root formation in roots of the WT and iaa13 mutant. (A–D) Twenty-day-old aerobically grown WT and iaa13 seedlings were further grown under aerated conditions for 48 h. (A) Cross-sections at 20, 30, and 40 mm from the tips of adventitious roots. Aerenchyma is indicated by arrowheads. (Scale bars, 100 μm.) (B) Percentages of aerenchyma in root cross-sectional area at 10, 20, 30, 40, and 50 mm. (C) Pictures of lateral roots at 15 to 25, 25 to 35, and 35 to 45 mm. Lateral root primordia visualized by Feulgen staining are indicated by arrowheads. (Scale bar, 500 μm.) (D) Numbers of lateral roots at 5 to 15, 15 to 25, 25 to 35, 35 to 45, and 45 to 55 mm. In B and D, significant differences between the genotypes at **P < 0.01 (2-sample t test). (E–H) Twenty-day-old aerobically grown WT seedlings were further grown under aerated conditions with 0, 0.05, or 0.5 µM NPA (E and F), and with 0, 1, or 10 µM IAA without (G) or with 0.01 µM NPA (H) for 48 h. Percentages of aerenchyma (E, G, and H) and numbers of lateral roots (F) are shown. Boxplots show the median (horizontal lines), 25th to 75th percentiles (edges of the boxes), minimum to maximum (edges of the whiskers), and mean values (dots in the boxes) (n = 9). In E–H, different lowercase letters denote significant differences among the conditions (P < 0.05, one-way ANOVA followed by Tukey’s test for multiple comparisons).

