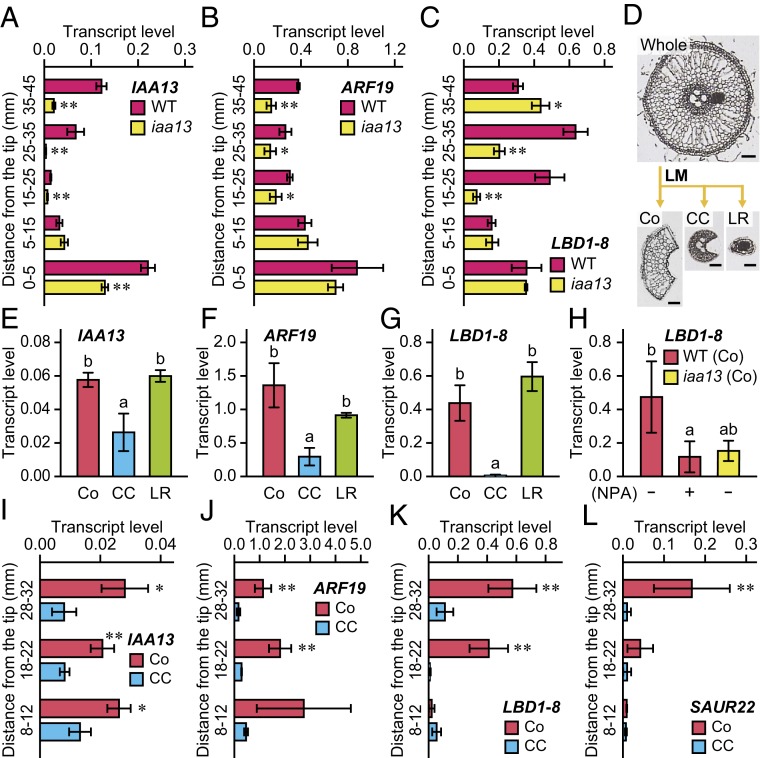
Fig. 2.
Expression analysis of auxin-related genes in roots of the WT and iaa13 mutant. (A–G) Twenty-day-old aerobically grown WT and iaa13 seedlings were further grown under aerated conditions for 48 h. Shown are relative transcript levels of IAA13 (A), ARF19 (B), and LBD1-8 (C) at 0 to 5, 5 to 15, 15 to 25, 25 to 35, and 35 to 45 mm from the tips of adventitious roots of the WT and iaa13. (D) Isolation of the cortex (Co), central cylinder (CC), and lateral root (LR) by laser microdissection (LM). (Scale bars, 50 μm.) Relative transcript levels of IAA13 (E), ARF19 (F), and LBD1-8 (G) in the cortex, central cylinder, and LR at 18 to 22 mm of the WT roots. (H) Relative transcript levels of LBD1-8 in the cortex at 18 to 22 mm of the WT roots under aerated conditions with or without 0.5 µM NPA and of iaa13 without NPA for 48 h. (I–L) Twenty-day-old aerobically grown WT seedlings were further grown under aerated conditions for 48 h. Shown are relative transcript levels of IAA13 (I), ARF19 (J), LBD1-8 (K), and SAUR22 (L) in the cortex and central cylinder at 8 to 12, 18 to 22, and 28 to 32 mm. The gene encoding transcription initiation factor IIE served as a control. Values are mean ± SD (n = 3). Significant differences between the genotypes (A–C) or tissues (I–L) at **P < 0.01 and *P < 0.05 (2-sample t test). Different lowercase letters denote significant differences among the tissues (E–G), or genotypes and conditions (H) (P < 0.05, one-way ANOVA followed by Tukey’s test for multiple comparisons).

