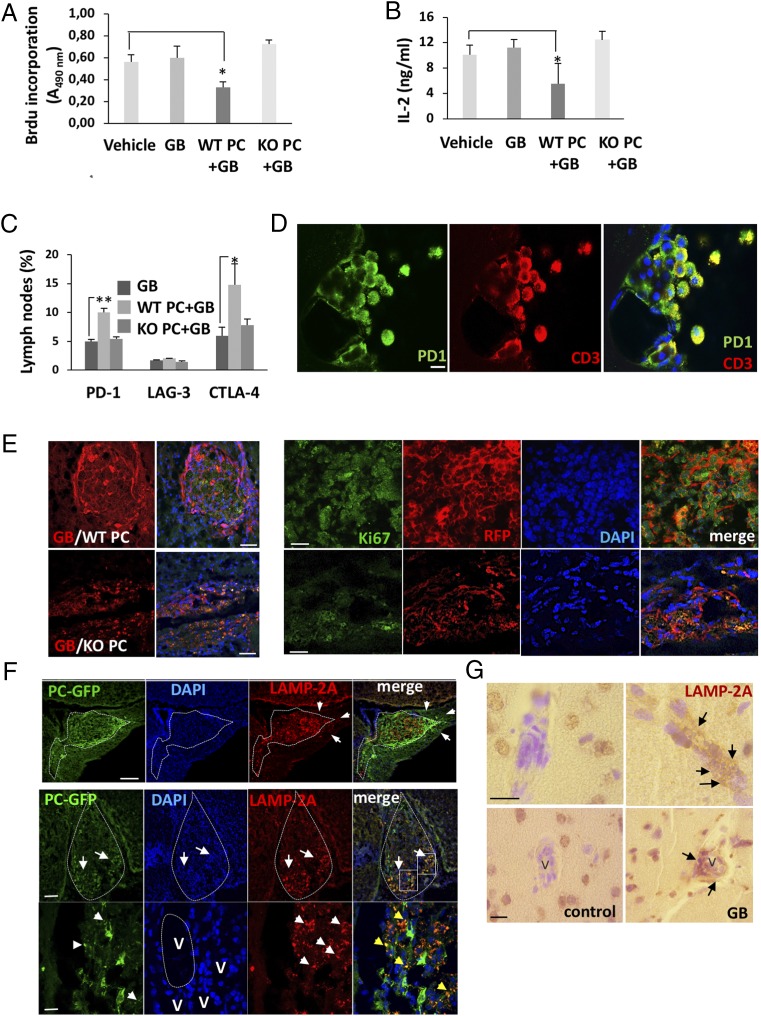
Fig. 7.
GB-induced CMA in PC assists tumor growth. (A) Activation-induced cell proliferation and (B) IL-2 production were measured in CD4+ T cells isolated from maxillary and cervical lymph nodes from xenografted mice with WT PC and GB cells (WT PC+GB) or KO PC and GB cells (KO PC+GB) and compared to T cells from control mice xenografted with GB cells or PBS (vehicle). Cells were activated ex vivo with anti-CD3 and anti-CD28 for 72 h. All data represents mean ± SD of at least 3 independent experiments; *P < 0.05. (C) Flow cytometry analysis of the expression if coinhibitory receptors in CD4+ T cells isolated from lymph nodes (maxillary, cervical, and axillary) from xenografted mice with WT PC and GB cells (WT PC+GB) or KO PC and GB cells (KO PC+GB) and compared to T cells isolated from control mice xenografted with GB cells. *P < 0.05; **P < 0.01. (D) Expression of PD-1 was detected by immunofluorescence in T cells from the cerebrospinal fluid of meninges of grafted mice with GB and WT PC. (Scale bar, 10 μm.) (E) GB tumor growth in mice that were xenografted with cocultures of WT PC+GB cells (GB/WT PC) and compared to mice xenografted with KO PC+GB cells (GB/KO PC) (Scale bars of Left, 250 μm.) Right shows representative detail of proliferating GB cells, which appear as intense RFP+ fluorescent spherical dividing cells (red) and Ki67+ (green). Confocal microphotographs (1-μm-thick section). (Scale bar, 50 μm.) (F) Expression of LAMP-2A in PC and GB cells in xenografts of cocultured PC expressing GFP (PC-GFP) and GB cells. Upper shows delimited tumor with heterogenous and stronger expression of LAMP-2A in the right pole next to perivascular areas (arrows). Merged image of confocal microphotographs (1-μm-thick section) shows the colocalization of LAMP-2A expression in the GB cells and perivascular cells. (Scale bar, 100 μm.) Lower shows PC in those tumor infiltration areas as GFP+ cells (green). These cells accumulated in the ventral pole of the tumor (arrows). (Scale bar, 250 μm.) Nuclear staining by DAPI (blue) shows that tumor cellularity was higher in the ventral pole (arrows). Strong LAMP-2A (red) expression in the ventral pole of the tumor is indicated (arrows) and compared to the rest of the tumor where hardly any GFP+ PC are localized. Merged image shows the colocalization of grafted PC and the strong expression of LAMP-2A in the peritumoral areas and around blood vessels, where also endogenous PC of the mice are situated. Insets show the areas in detail of bottom pictures. High power pictures showing GFP+ and LAMP-2A+ punctate pattern (arrowheads) colocalization around blood vessels (V). (Scale bar, 45 μm.) All Images are representative of data from GB+WT PC grafted mice (12 tumors/15 grafted mice) and GB+KO PC grafted mice (0 tumors/15 grafted mice). Mice were analyzed 4 to 11 wk after graft. Images are representative of at least 3 different experiments using U87 or U373 GB lines independently. (G) Representative images of LAMP-2A expression (arrows) in perivascular areas (V) of 8 brain biopsies from GB patients compared to 6 control fields in the not infiltrated brain areas. (Scale bar, 50 μm.)

