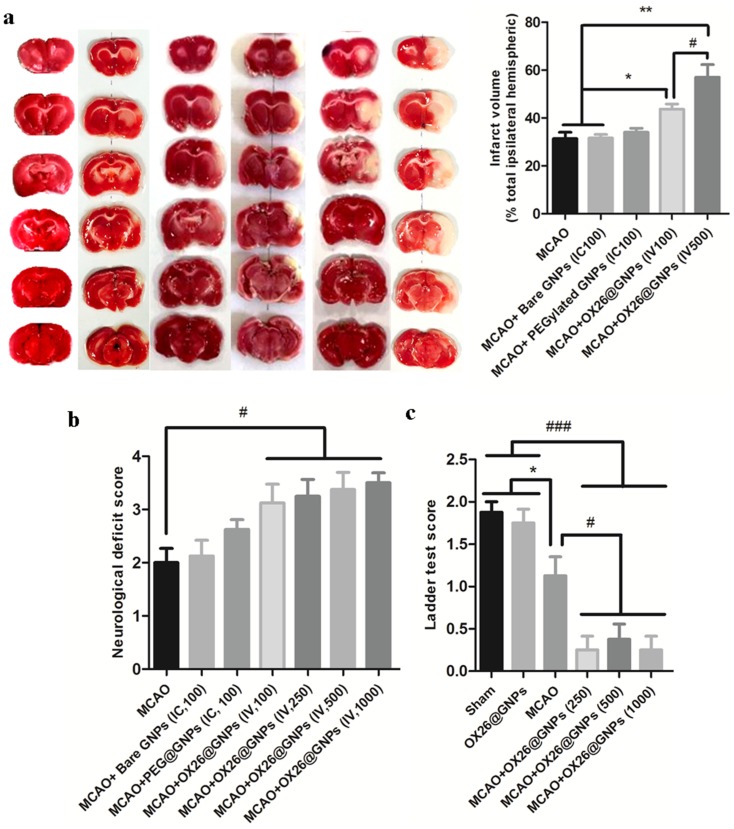
Figure 4.
The effect of OX26@GNPs on infarct volume and neurological deficits. a) Representative images of infarct size at 72 h post-MCAO by TTC staining in the sham, MCAO and OX26@GNPs+MCAO (500 μg/mL, i.v. dose of GNPs) (**P<0.01 between indicated groups, n=5, #P<0.05 between indicated groups). b) neurological deficit score at 72 h post-MCAO (#P<0.05 between indicated groups), and c) ladder test (*P<0.05, #P<0.05, ###P<0.001 between indicated groups, data presented as means ± SEMs).

