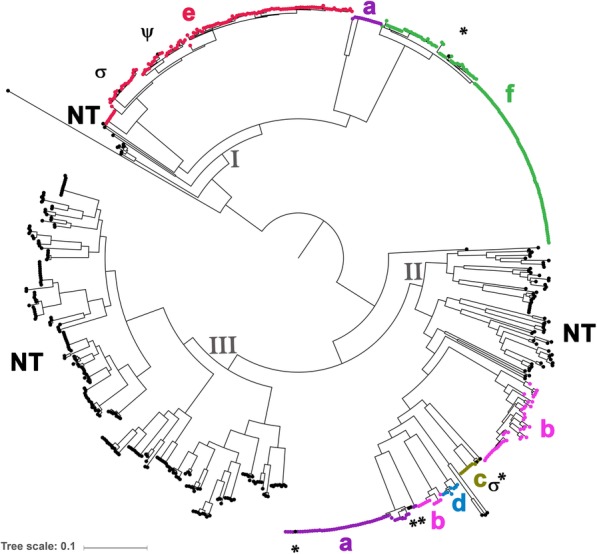
Fig. 1.

Population structure of H. influenzae isolates. The genomic relatedness of 688 Hi isolates is depicted as a maximum likelihood phylogeny. The three main clades (I, II, and III) are labeled on the tree and each isolate is color coded by the serotype, as determined by slide agglutination. The NTHi isolates within the serotype-specific subclades are denoted by ψ, σ, or *. The ψ indicates the isolate that had discrepant serotyping results between WGS and SAST methods. The σ indicates the only two NTHi isolates that contained an internal stop codon within a capsule gene. The * indicates the remaining five NTHi isolates (capsule nulls) that were detected within serotype-specific subclades. The tree scale is 0.1 substitutions per site along the length specified. Bootstrap values were 100/100 for all major nodes
