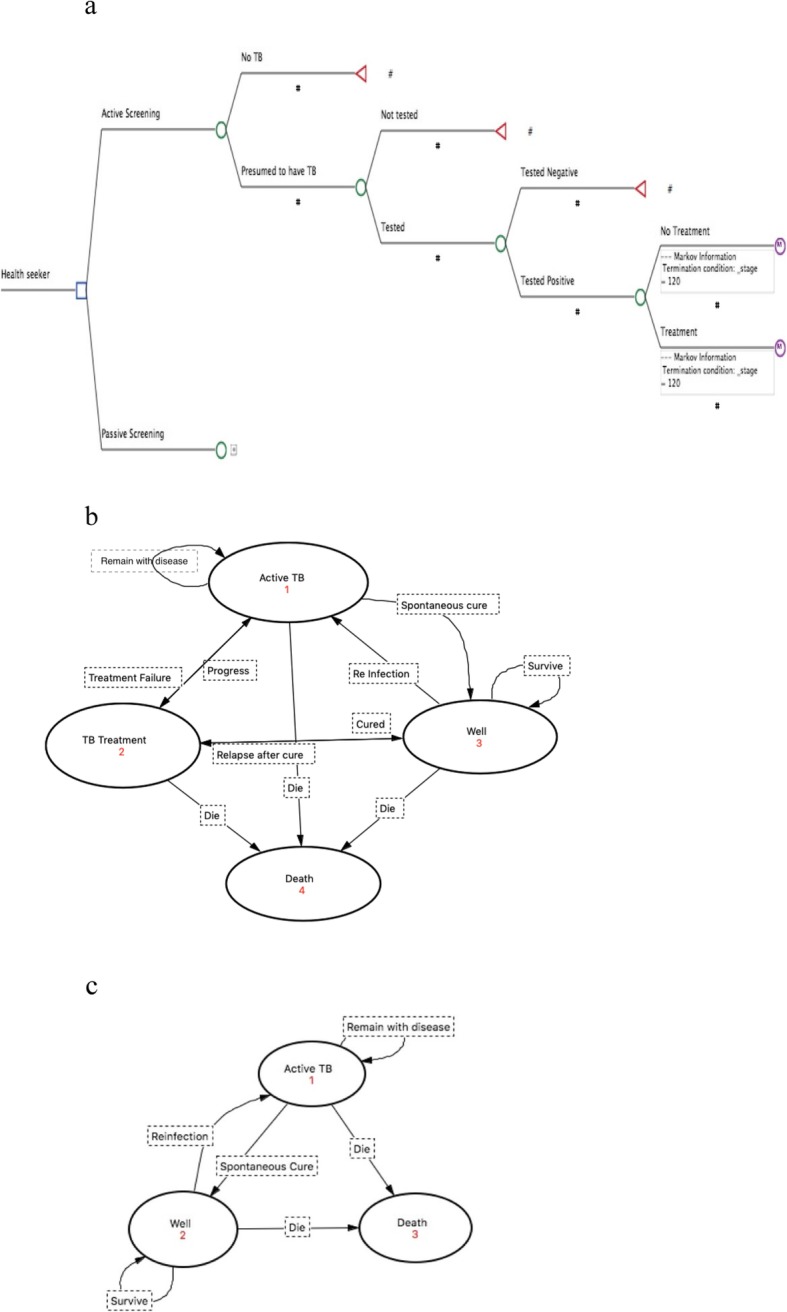
Fig. 1.

a Decision Tree of the model capturing the short-term outcomes of screening and testing. b State Transition Diagram illustrating the Markov model capturing longer-term costs and health effects when TB patients receive treatment. c State Transition Diagram illustrating the Markov model capturing longer-term costs and health effects for TB patients in the absence of treatment
