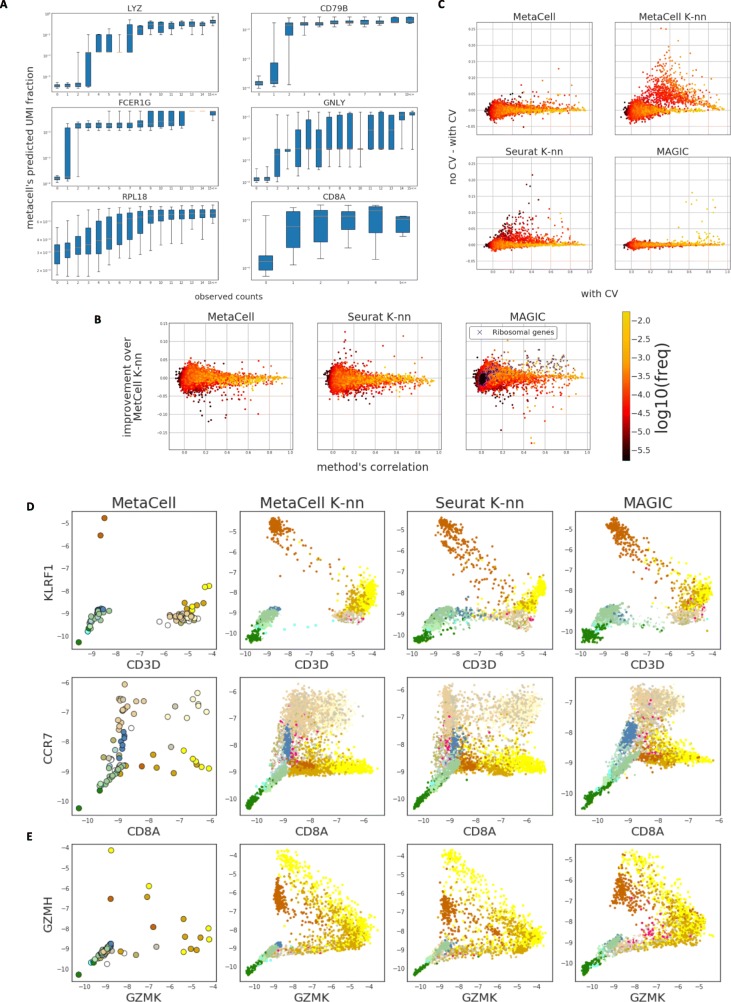
Fig. 3.
MCs robustly approximate the expression manifold. a Boxplots show the distribution of predicted (using MC pool frequencies) UMI fraction per cell stratified according to observed number of UMIs in down-sampled single cells. b Shown are per-gene Pearson correlations between predicted and observed gene frequencies for genes, color coded according to the gene’s frequency across all cells. In all cases, predictions are generated using a 100-fold cross-validation scheme (see the “Methods” section for exact description of the procedure and the strategies compared). Predictions using K-nns over raw MC similarities (a different neighborhood per cell consisting of its k most similar neighbors) are used as reference. It is compared to strategies defining cell neighborhoods using MCs (fixed disjoint grouping of cells), K-nn over Seurat distances, and MAGIC distances (weighted neighborhood according to diffusion distances). c Similar to panels in b but comparing accuracy with and without applying cross validation. Points with high value along the y axis represent potential over-fitting. d, e Per-MC (left most column) or smoothed per-cell (all other columns) expression values for pairs of genes, portraying putative transcriptional gradients

