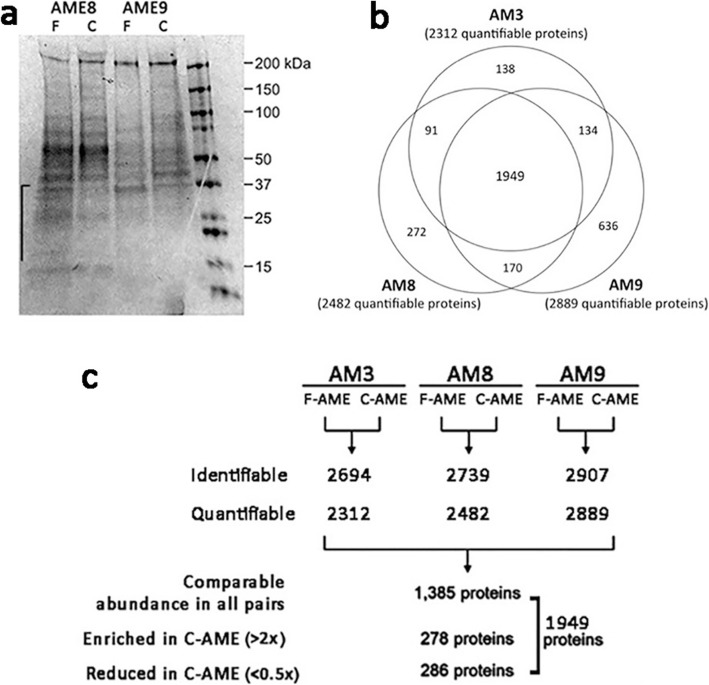
Fig. 1.
Soluble amnion extract protein profiles. a Denaturing gel electrophoresis of amnion extract proteins from fresh and cryopreserved human amnion (F-AME and C-AME). Twenty micrograms of protein prepared from fresh and frozen amnion of two donor tissues, AME8 and AME94 was subjected to 4–20% SDS-PAGE. Major protein bands distribution was revealed after Coomassie brilliant-259 blue staining. Proteins below molecular mass 40 kDa were relatively depleted in C-AME samples. The right-most lane is molecular size ladder. b Pie chart representation of quantifiable protein distribution from 3 amnion samples. c Experimental approach for iTRAQ proteomic profiling of F-AME and C-AME obtained from 3 different amnion samples (AM3, AM8, AM9). The amount of identifiable and quantifiable proteins is listed. The number of proteins comparatively present (< 2 and > 0.5 fold), enriched (> 2 folds) and reduced (< 0.5 fold) in all amnion samples are indicated

