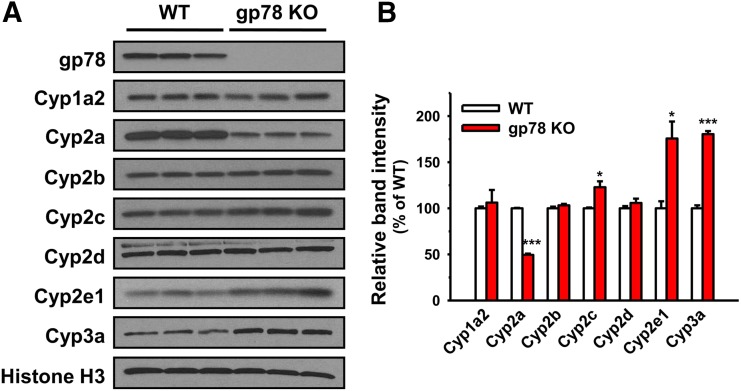
Fig. 2.
IB analyses of constitutive hepatic P450s from WT and gp78-KO mice. (A) IB analyses of a representative mouse sample. (B) Densitometric quantification of the approx. 50–55 kDa P450 band from hepatocytes freshly isolated and uncultured from three individual WT and gp78-KO mice. See Materials and Methods for details. Values (mean ± S.D.) of three individual experiments, each employing two culture plates (technical replicates) of hepatocytes isolated from each of the three mice. Statistical significance determined by the Student’s t test, *,***P < 0.05, and 0.001 vs. WT, respectively.

