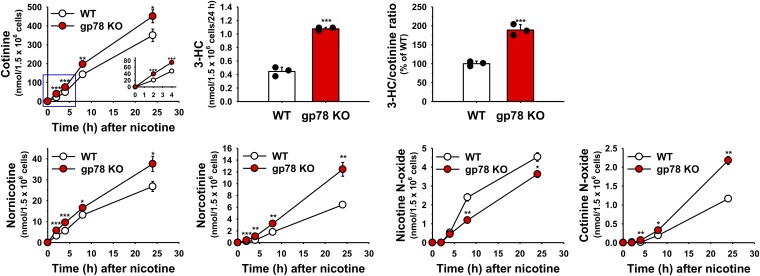
Fig. 8.
Relative nicotine metabolism in cultured WT and gp78-KO mouse hepatocytes. PB-pretreated hepatocytes from WT and gp78-KO mice were cultured, and on day 4 incubated with nicotine for 0–24 hours. Aliquots of media were taken at the time points indicated and assayed as detailed in Materials and Methods. The insert in the cotinine production graph is a magnified view of the initial three time points demarcated by the blue square. 3-HC levels and 3-HC/cotinine ratios were determined at 24 hour. Values (mean ± S.D.) of three individual cultures. Statistical significance determined by the Student’s t test, *P < 0.05 vs. WT, **P < 0.01 vs. WT, ***P < 0.001 vs. WT.

