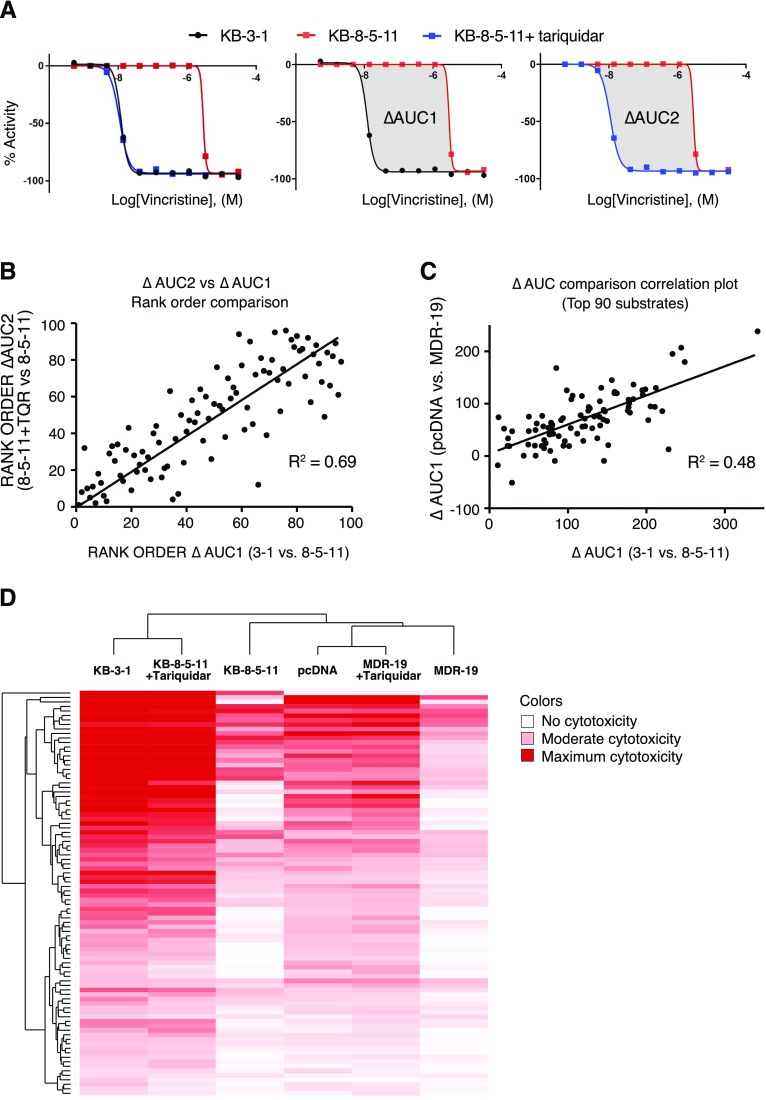
Fig. 2.
Summary of P-gp substrate analysis. (A) Summary of data analysis. For each compound, data are displayed as “loss of signal from baseline,” where −100% represents total cell killing. KB-3-1 cells are sensitive (black), KB-8-5-11 cells are resistant (red) but sensitized when P-gp inhibitor tariquidar is added (blue), left. To perform HTS data analysis, AUCs were determined for the parent and resistant lines, and the difference in AUC (termed ΔAUC) was used to identify putative substrates. ΔAUC1 is the difference in AUC in the KB-3-1 (black line) sensitive cells compared with KB-8-5-11 (red line) resistant cells (center); ΔAUC2 is the difference in AUC of KB-8-5-11 resistant cells in the absence (red line) and presence (blue line) of tariquidar (right). Comparison of the AUC for substrates calculated using ΔAUC1 and ΔAUC2, assessing (B) rank order of substrates (where largest ΔAUC is strongest substrate) and (C) orthogonal data generated testing P-gp substrates against HEK cells. (D) Unsupervised clustering of compound activity against parent and resistant lines (with and without tariquidar), where deep red represents greatest cytotoxicity.

