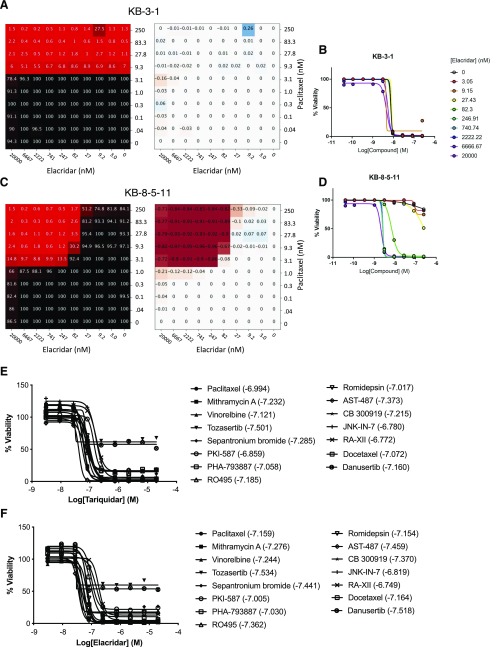
Fig. 5.
Substrate synergy with P-gp inhibitors. Sample combination of elacridar and paclitaxel tested in 10 × 10 dose-response matrices with KB-3-1 (A and B) and KB-8-5-11 (C and D). (A and C) Left, percent response of cell viability where red = cell death, black = cell survival. (A and C) Right, matrix plot in ΔBliss model, magenta = synergy. (B and D) Dose-response curves extracted from synergy blocks for paclitaxel with increasing concentrations of elacridar. Dose-response curves for (E) tariquidar and (F) elacridar for all substrates tested (listed in Table 2). Values in parentheses are the log of the molar concentration of tariquidar or elacridar needed to achieve maximum cell killing when combined with the noted drugs.

