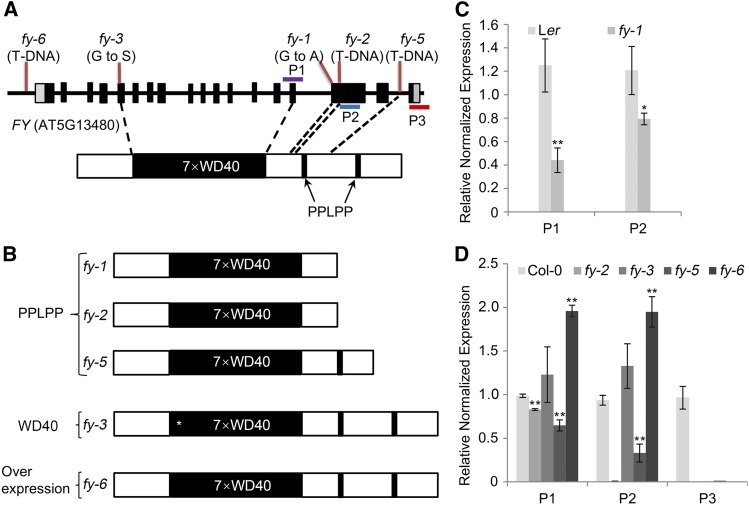
Figure 1.
Schematic Representation of FY and Its Mutants, and the Transcriptional Level of FY.
(A) FY gene (top) and protein (bottom). The top of the gene shows the position of fy mutations. The black boxes and lines represent exons and introns, respectively. The FY protein contains seven WD40-repeats and two PPLPP-domains. The purple, blue, and red bars show the RT-qPCR amplicons located in 7×WD40-repeats (P1), the first PPLPP-domain (P2), and the second PPLPP-domain (P3) regions.
(B) Schema of FY in mutants. PPLPP-domain deficiency in fy-1, fy-2, and fy-5. The first WD40-repeat amino acid was changed in fy-3 and indicated by an asterisk (*). FY is overexpressed in fy-6 line.
(C) and (D) RT-qPCR quantification of FY transcription level in the mutants and wild types. The wild type of fy-1 is Ler, and wild type for the rest is Col-0. RT-qPCR quantification of FY expression levels in fy-1, fy-2, fy-3, fy-5, fy-6, and the wild type were done in the P1 and P2 regions, and only fy-5 was performed in the P3 region. Error bars represent sd from three biological replicates, and asterisks are indicative of statistically significant differences between the wild type and mutant using one-way ANOVA (*P-value < 0.05, **P-value < 0.01).

