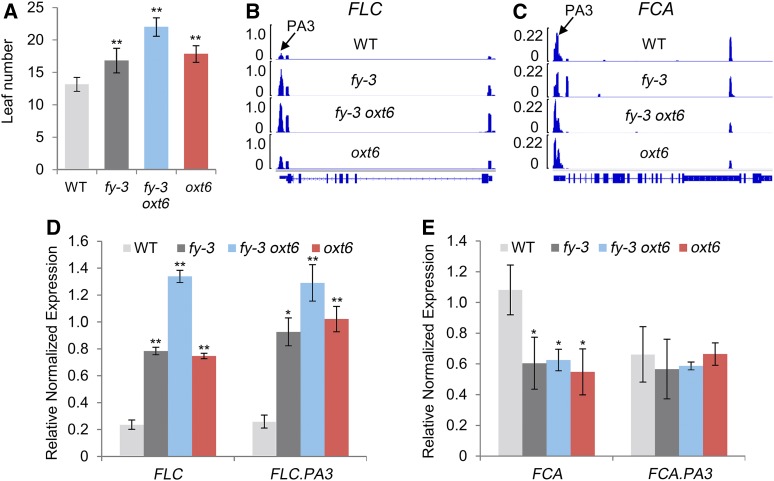
Figure 11.
Analysis of Flowering Phenotype and Related Gene APA.
(A) Flowering time was measured by counting the number of rosette leaves at flowering under long-day photoperiods in the incubator. Each pool contained one plant. Each experiment comprised 18 pools, and three independent experiments were completed. WT, wild type.
(B) and (C) Sequencing coverage of FLC and FCA were visualized by Integrative Genomics Viewer software.
(D) and (E) Distal transcript and total gene expression of FLC and FCA were verified by RT-qPCR. Error bars represent sd from three biological replicates, and asterisks are indicative of statistically significant differences using one-way ANOVA (*P-value < 0.05; **P-value < 0.01).

