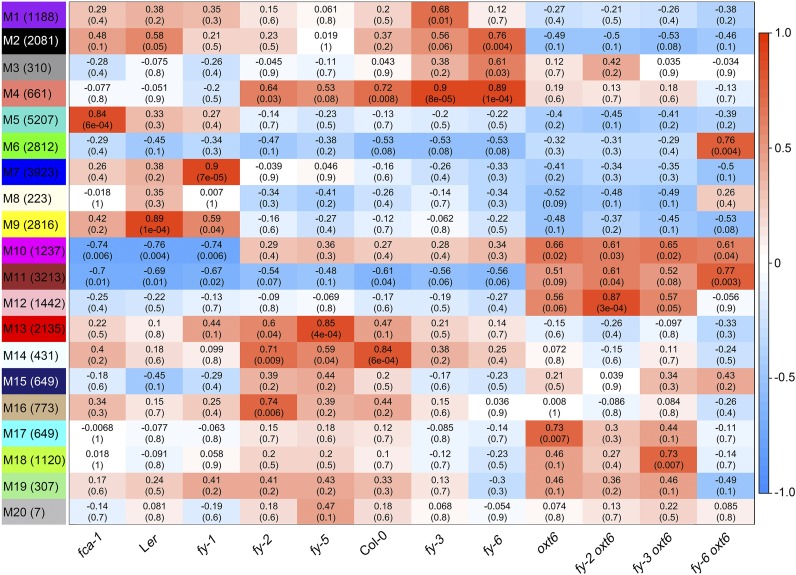
Figure 4.
A Heatmap of Module-Sample Associations.
(Left) The 20 modules (M1 to M20), with the number in parentheses representing the transcript number. Each row corresponds to a module, and each column corresponds to a mutant line or the wild type. The color scale on right shows module-mutant correlations from 1 (red) to −1 (blue). The color of each cell at the row–column intersection represents the correlation coefficient (top values) between the modules and samples. Red color indicates a high degree of positive correlation, and blue color indicates a high degree of negative correlation, between each module and the mutant or wild type. Each cell also contains the corresponding P-value (bottom values).

