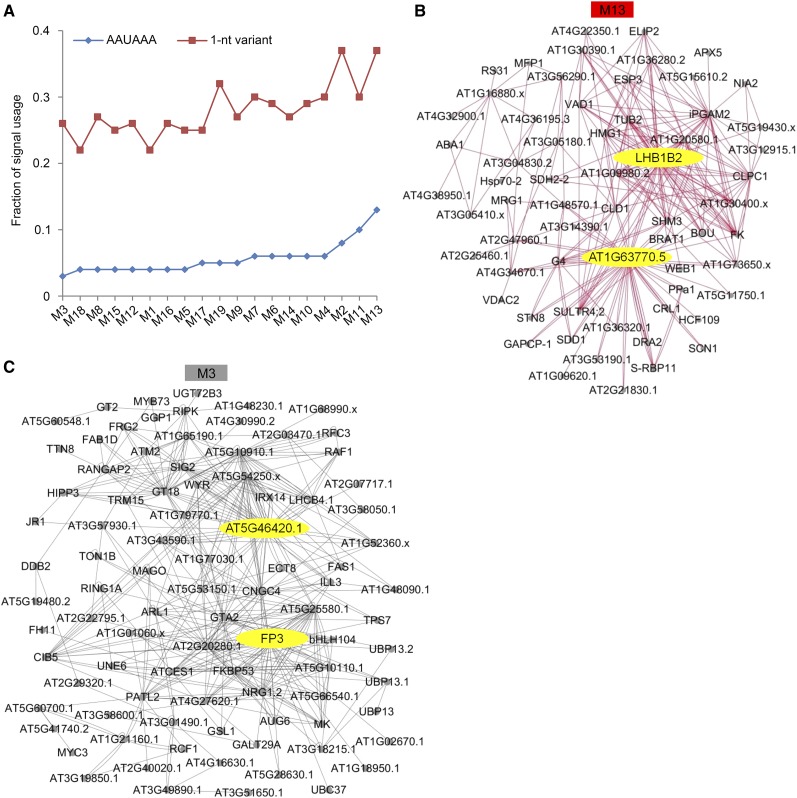
Figure 5.
Coexpression Network Analysis of Specific Modules.
(A) AAUAAA signal and its one-nucleotide variant signal of the NUE region [between 10 and 35 bases upstream of poly(A) sites] are analyzed in each module. nt, nucleotide.
(B) and (C) Network of the 63 and 91 highly connected transcripts in M13 and M3, respectively. The networks were visualized using Cytoscape 3.6.0 software, and the protein name or gene ID (no protein name) are shown in the figure. Candidate hub genes in the module are shown in yellow.

