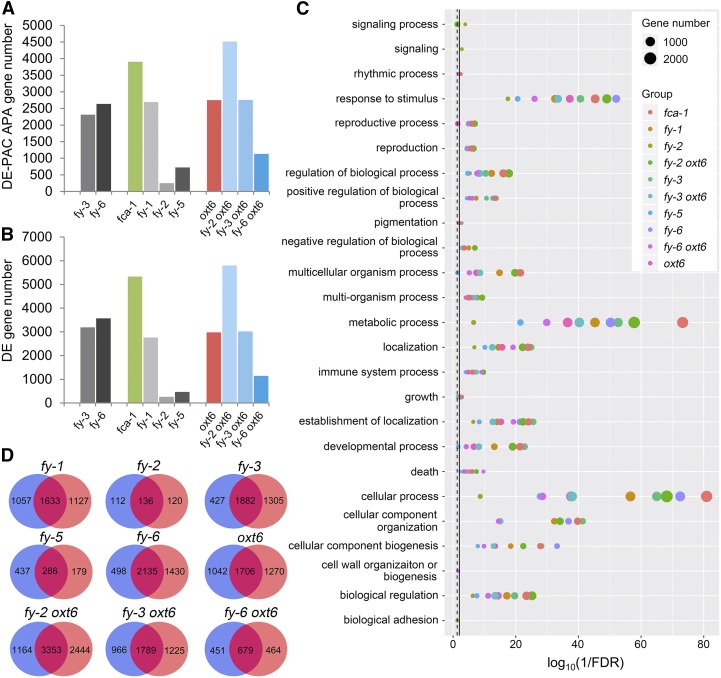
Figure 6.
Analysis of DE PAC APA Genes and DE Genes.
(A) and (B) Bar graph showing the number of DE-PAC APA genes and DE genes, which were analyzed by DESeq2 package. An adjusted P-value < 0.05 threshold was considered statistically significant.
(C) GO enrichment analysis of DE-PAC APA genes. All significant GO terms of biological process at the second level were shown. Solid line, FDR = 0.01; dashed line, FDR = 0.05.
(D) Venn diagram of DE-PAC APA genes and DE genes. The blue circle represents DE-PAC APA gene; the orange circle represents DE gene. The number in the circles show DE-PAC APA gene or DE gene count. The percentage of DE gene belong to DE-PAC APA gene is 58% in fy-1, 53% in fy-2, 59% in fy-3, 62% in fy-5, 60% in fy-6, 57% in oxt6, 58% in fy-2 oxt6, 59% in fy-3 oxt6, and 59% in fy-6 oxt6.

