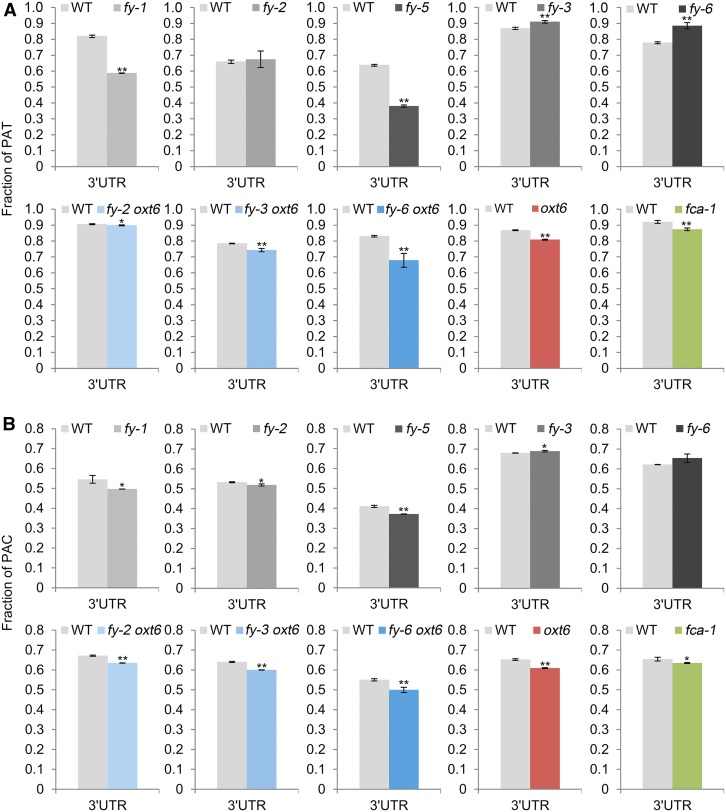
Figure 8.
Distributions of PATs and PACs Selected from DE-PACs (|Fold Change| ≥ 2) in 3′ UTR.
(A) and (B) PATs distribution (A) and PACs distribution (B). Error bars represent sd from three biological replicates, with 10 plants in each repeat, and asterisks are indicative of statistically significant differences using one-way ANOVA (*P-value < 0.05; **P-value < 0.01).

