Figure 4.
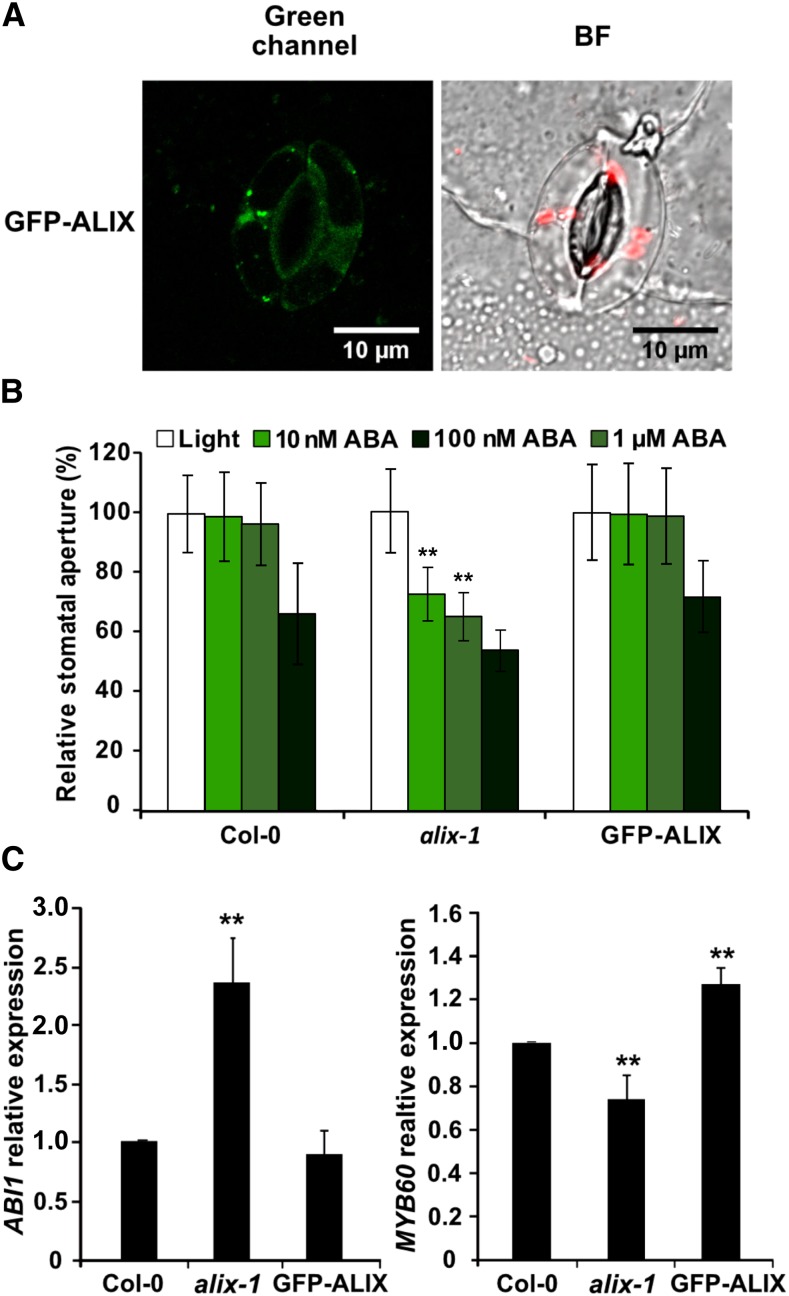
Hypersensitivity to ABA in alix-1 Stomata.
(A) Confocal fluorescence images showing GFP-ALIX localization in the cytoplasm and punctuate structures of wild-type guard cells. Bar=10 µm.
(B) Analysis of stomatal closure in response to different concentrations of ABA in alix-1 mutant, wild-type (Col-0), and GFP-ALIX/alix-1 (labeled as GFP-ALIX) lines. Data are presented as percentage relative to each genotype under light conditions (100% stomatal aperture). Values shown are averages ±se from three replicates (n = 70 in each replicate).
(C) RT-qPCR-analysis of the expression of ABA responsive genes ABI1 and MYB60 in soil-grown alix-1 mutants, wild-type (Col-0), and GFP-ALIX/alix-1 plants.
**p < 0.01 (Student’s t test; Supplemental Data Set 2) with respect to the wild type in the same experimental conditions. Data are means of three biological replicates with two technical replicates per sample. Error bars represent sd.

