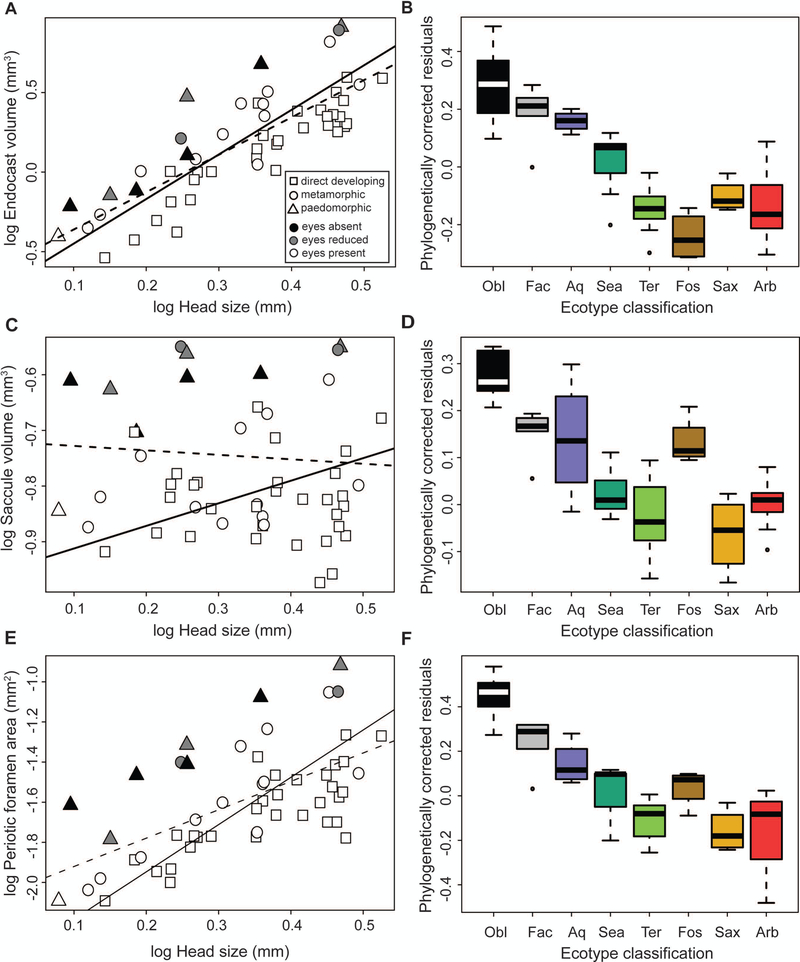
Figure 3.
Linear regressions of (A) otic endocast volume, (C) relative saccule volume (calculated as a proportion of total endocast volume), and (E) periotic foramen area against head size; results of both GLS (dotted line) and PGLS (solid line) models are shown. Symbol shape indicates developmental strategy and color indicates external eye size. Boxplots represent the phylogenetic residuals of (B) endocast volume and (D) relative saccule volume, and (F) periotic foramen area grouped by ecotype classification.

