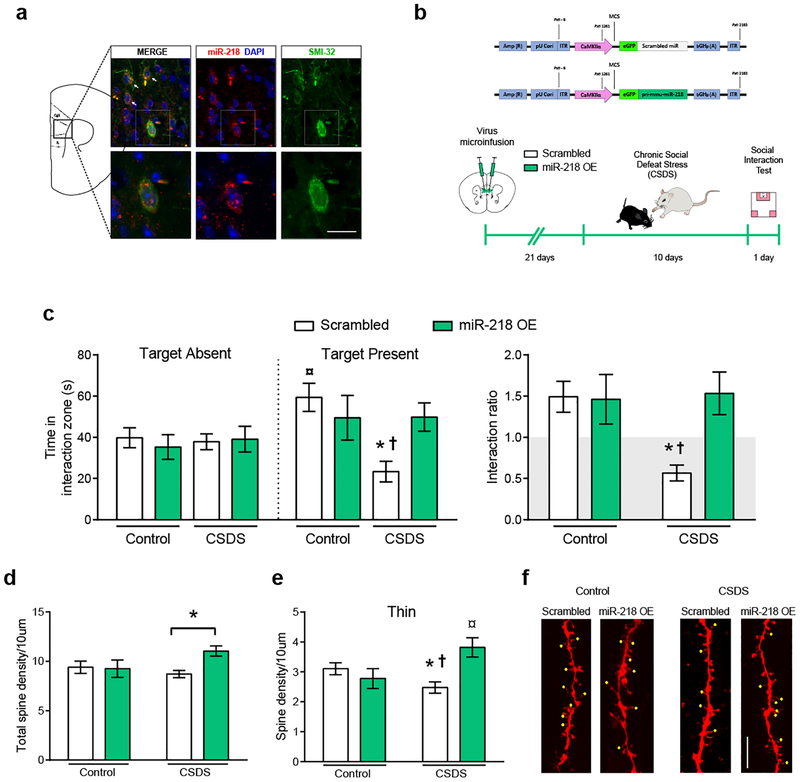
Figure 2. Overexpression of miR-218 in mPFC pyramidal neurons protects against stress-induced CSDS and alterations in spine morphology.
(a) Representative coronal brain section of a stress-naïve adult mouse showing miR-218 expression in SMI-32-positive mPFC pyramidal neurons (white arrows). Scale bar=10 μm. (b) Schematic of the scrambled control (Scrambled) and CaMKIIα-miR-218 overexpression (miR-218 OE) adeno-associated viral (AAV) constructs and timeline of viral infection experiments. (c) miR-218 overexpression in mPFC pyramidal neurons prevents social avoidance induced by CSDS and, thereby, promotes resilience. Time in the interaction zone: Three-way ANOVA: No main effect of stress: F(1,86)= 2.67; p=0.10; target: F(1,86)= 2.05; p=0.15; or virus: F(1,86)= 0.80; p=0.37. Significant stress by virus interaction: F(1,86)= 4.32; p=0.041. Post hoc Tukey test reveals reduced time in the social interaction zone in CSDS-Scrambled (n=15) during the session with target present in comparison to Control-miR-218 OE (n=11), and CSDS-miR-218 OE (n=12); *p<0.05, and Control-Scrambled (n=9), †p<0.01. Control-Scrambled group spend significantly more time exploring the social interaction zone during the session with target present in comparison to target absent; ¤p<0.01. Social interaction ratio: Two-way ANOVA: main effect of virus: F(1,43)= 4.62; p= 0.03; stress: F(1,43)= 3.85; p= 0.056; and significant stress by virus interaction: F(1,43)= 5.26; p= 0.026; Tukey test: *p<0.05, different from Control-Scrambled and Control-miR-218 OE; †p<0.01, different from CSDS-miR-218 OE. (d) miR-218 overexpression in pyramidal neurons increases dendritic spine density (30%) in the mPFC of socially-defeated mice. Two-way ANOVA: main effect of virus: F(1,82)= 3.11; p= 0.08; no significant effect of stress: F(1,82)= 0.78; p= 0.37; and significant stress by virus interaction: F(1,82)= 3.94; p= 0.05. Post hoc Tukey test: *p<0.05, significantly different from CSDS-Scrambled. (e) miR-218 overexpression prevents stress-induced reduction in the density of mPFC thin spines specifically. Two-way ANOVA: main effect of virus: F(1,82)= 3.44; p= 0.06; no significant effect of stress: F(1,82)= 0.56; p= 0.45; and significant stress by virus interaction: F(1,82)= 9.31; p= 0.0031. Post hoc Tukey test: *p<0.05, significantly different from Control-Scrambled, †p<0.01, significantly different from CSDS-miR-218 OE, ¤p<0.01, significantly different from Control-miR-218 OE. (f) Representative images of dendritic segments from controls and CSDS-exposed mice injected with Scrambled and miR-218 OE viruses. Yellow dots indicate thin spines. Scale bar, 5μm.

