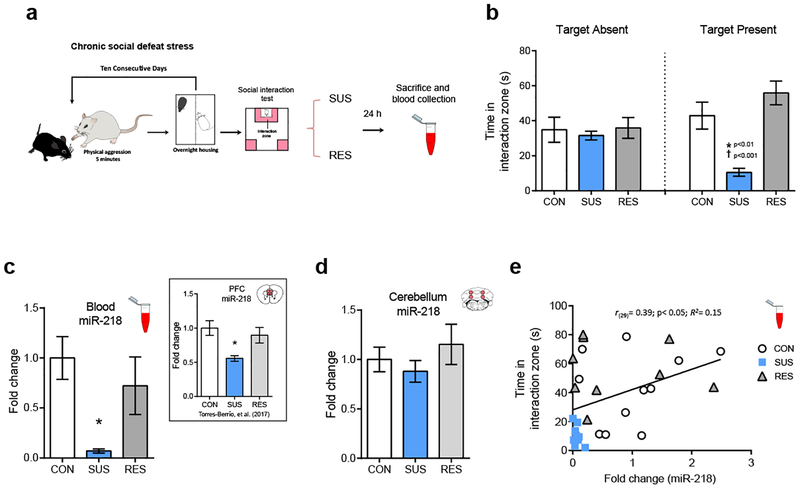
Figure 3. Blood expression of miR-218 correlates with social avoidance.
(a) Schematic and timeline of CSDS experiment. (b) Time in the interaction zone in control (CON; n=11), susceptible (SUS; n=9) and resilient (RES; n=9). Two-way ANOVA: main effect of stress: F(2,52)= 8.25; p˂ 0.001; main effect of session: F(2,52)= 0.21; p=0.64; and significant stress by target interaction: F(2,52)= 5.58; p˂0.01. Post hoc Tukey test: *p˂0.01; different from CON; †p˂0.001; different from RES, in session with target present. (c) Reduced miR-218 levels in blood (~90%) in SUS: One-way ANOVA: F(2,26)= 5.189; p˂0.05; Tukey test: *p˂0.05; different from CON. Inset represents mean ± SEM of mPFC levels of miR-218 in CON, SUS and RES mice7 (f) There are no significant differences in the cerebellar levels of miR218 between CON, SUS and RES mice: One-way ANOVA: F(2,26)= 0.84; p=0.44. (e) Positive correlation between the levels of miR-218 in blood and the time spent in the interaction zone with the social target present.

