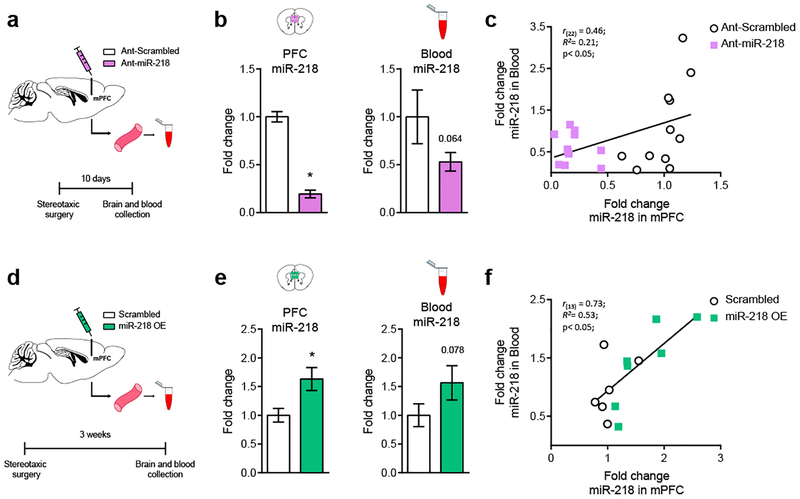
Figure 4. Levels of miR-218 in blood correlate with miR-218 levels in the mPFC.
(a) Schematic of experimental approach using Ant-miR-218. (b) Downregulation of miR-218 in the mPFC tends to decrease miR-218 expression in blood. mPFC: Fold change: t(20)= 11.9; p<0.0001. Blood: Fold change: t(20)=1.58; p= 0.064. (c) Positive correlation between miR-218 levels in mPFC and blood. Ant-scrambled: n= 11; Ant-miR-218: n= 11. (d) Schematic of experimental approach using miR-218 OE virus. (e) Overexpression of miR-218 in mPFC pyramidal neurons tends to increase miR-218 expression in blood. mPFC: Fold change: t(11)= 2.60; p= 0.025. Blood Fold change: t(11)= 1.52; p= 0.078. (f) Positive correlation between miR-218 levels in mPFC and blood. Scrambled: n= 6; miR-218 OE: n=7.

