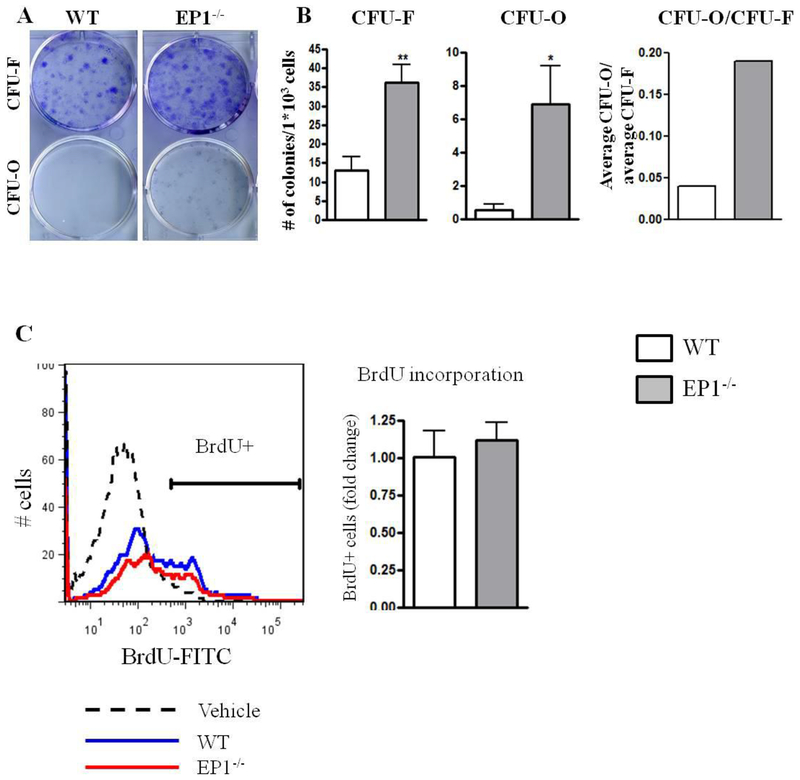
Figure 1: EP1−/− periosteal cells form more osteoblastic colonies.
Periosteal cells were isolated from WT or EP1−/− mice and plated at clonal density. Colonies were stained with Crystal Violet for CFU-F and Alkaline Phosphatase for CFU-O (A-B). Mice were injected with BrdU 2 hours before sacrificing. BrdU positive cells were measured using flow cytometry (C).
N=6 replicates per group for each assay. Error bars represent standard error of the mean. Statistical analysis was performed using paired student t-test. (*)=p<0.05 (**)=p<0.01 vs. age-matched WT.

