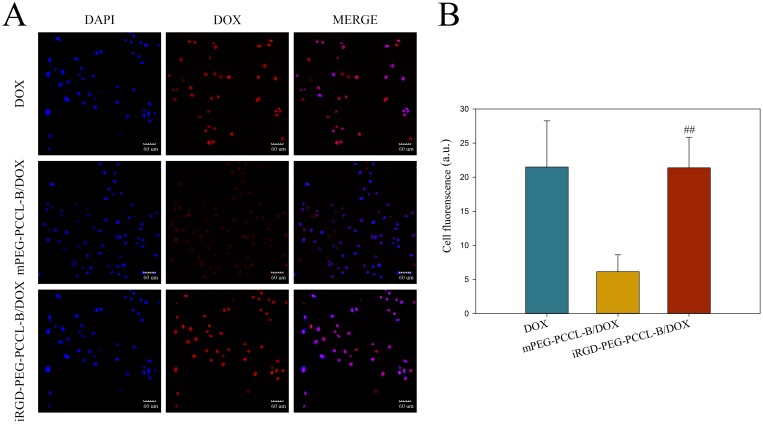
Figure 5.
Visualization and graph-based quantification of intracellular DOX. (A) Confocal fluorescence images of A549 cells localization of DOX 2 hrs post-incubation at the equivalent DOX dose of 0.5 μg/mL. Blue fluorescence signifies positive staining of DAPI and DOX is shown in red. Scale bar = 60 μm. (B) Quantified intensities (average optical density) of DOX signal by ImageJ ver 1.50i. Values are expressed as mean ± SD. ## P < 0.01 vs mPEG-PCCL-B/DOX group.

