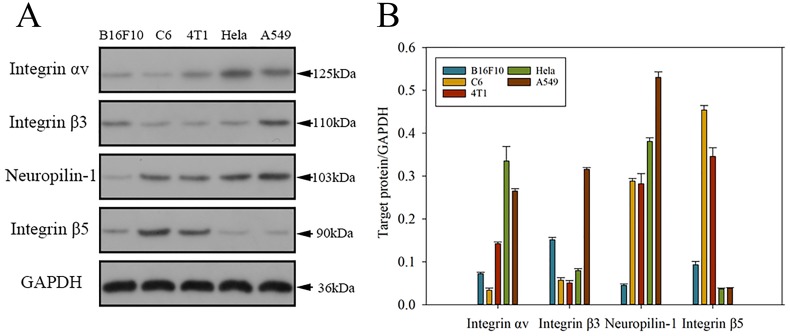
Figure 9.
Expressions and quantifications of integrin αv/β3/β5 and neuropilin-1 proteins in several cell lines (B16F10, C6, 4T1, Hela, and A549). (A) Representative Western blot diagram of the selected proteins in different cell lines. (B) Western blot-based quantifications of the chosen protein expressions in various cell lines. The results are expressed as mean ± SD (n = 3).

