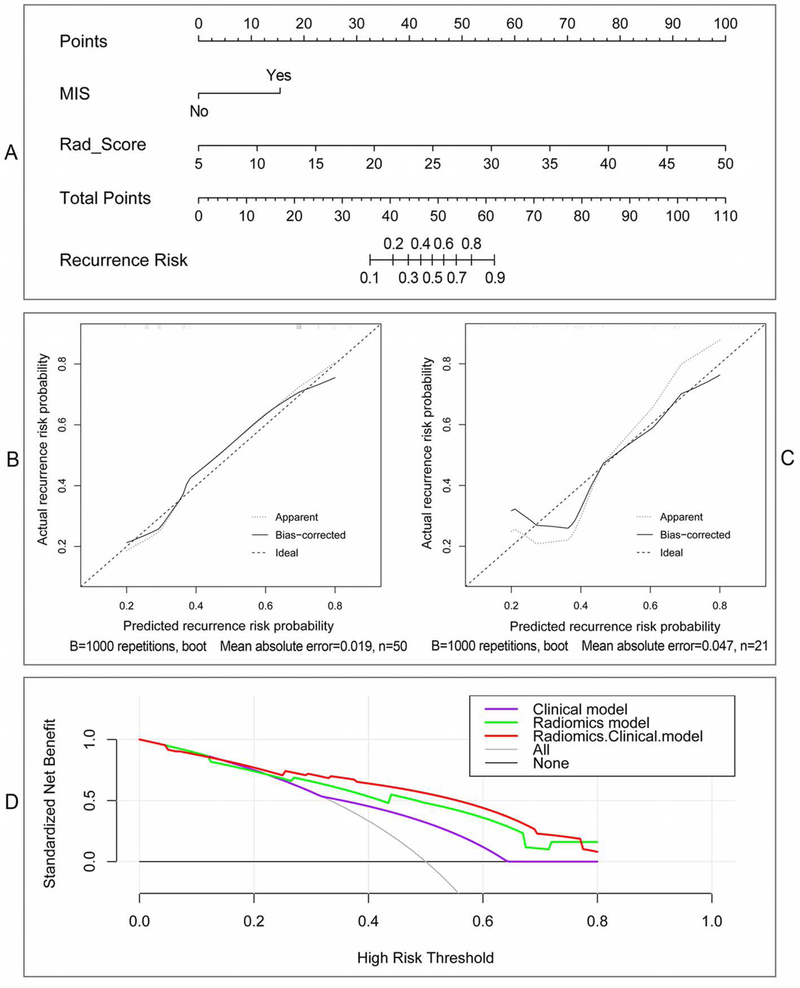
Figure 4.
Nomogram and its diagnostic performance by using the independent indicators: (A) The nomogram constructed with patient MIS and Rad_Score; (B) and (C) are calibration curves of the nomogram model with training and validation cohorts, respectively; (D) Decision curve analyses indicate the net benefit increment for the-first-two-year recurrence risk prediction by using the radiomics & clinical model compared with the radiomics model or the clinical model.

