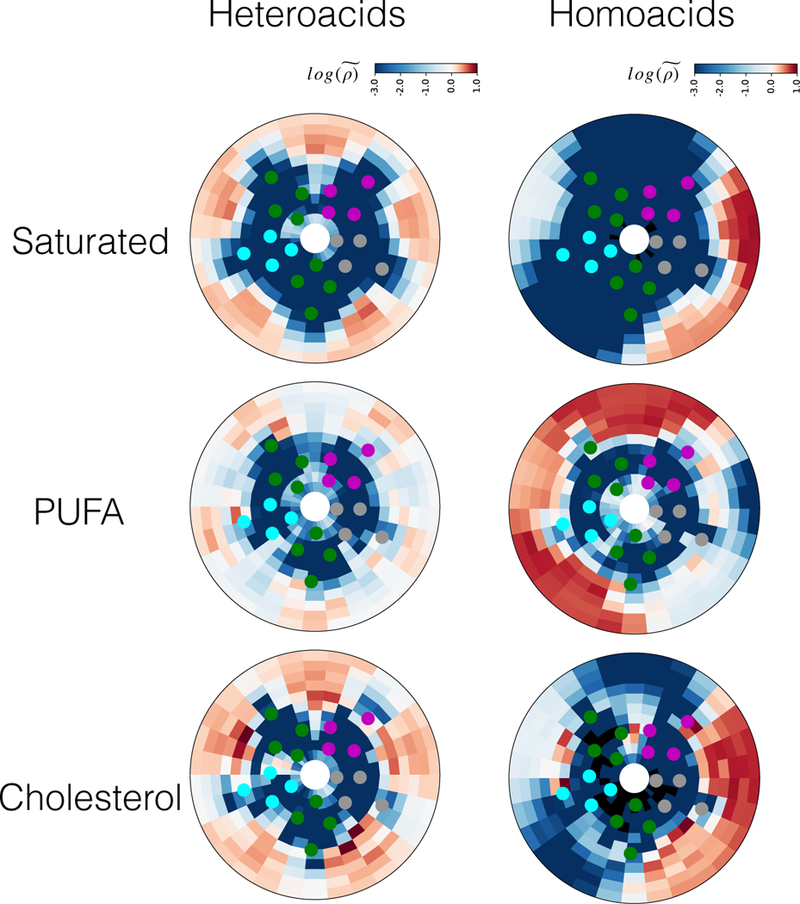
Fig. 5. Enrichment or depletion of lipid species surrounding a single nAChR.

Heatmaps represent normalized lipid densities as defined in Eq. 4, on a scale of -3 (blue, indicating depletion) to 1 (red, indicating enrichment). Densities were averaged over the last 8 µs of the 10 µs simulations and across three replicas.
