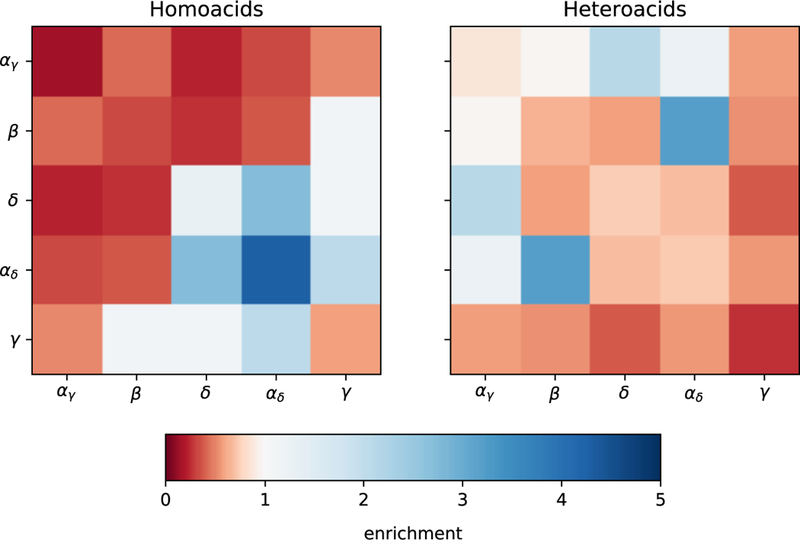
Fig. 7. Most probable subunit pairs among dimerizing proteins.

Heat-map showing the likelihood that two subunits were closest together among dimerizing proteins (100 Å threshold). Distinct subunits are each expected to form the closest pair 8 % of the time, while identical subunits are each expected to dimerize only 4 % of the time. Each color on the heatmap represents multiplicative depletion or enrichment relative to the pair’s expectation value, ranging from complete depletion (red) to no enrichment (white) to five-fold enrichment (blue).
