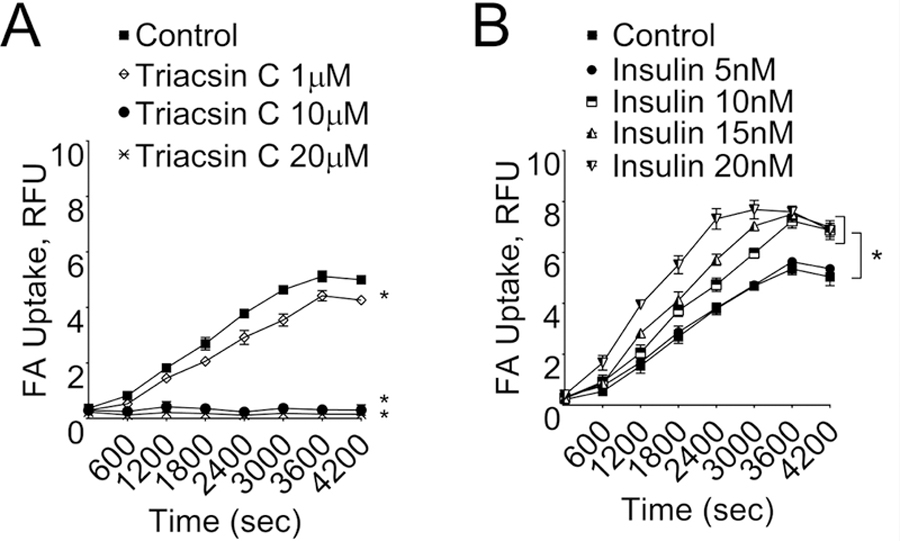
Fig. 3. Fatty acid uptake in isolated primary epididymal adipocytes assessed using fluorescence assay.
(A) In absence or presence of different concentrations (1, 10 and 20 μM) of triacsin C, the FATP-inhibitor and (B) in absence or presence of different concentrations (5, 10, 15 and 20 nM) of insulin, the FATP-activator. *significantly different control adipocytes (without triacsin C treatment) (A), *-significantly different control adipocytes (without insulin treatment) (B). Results are mean+SEM; Data were analyzed using one-way ANOVA followed by Neuman-Keuls post hoc test and Student’s t test, p<0.05; N=3 in each group.

