Figure 1.

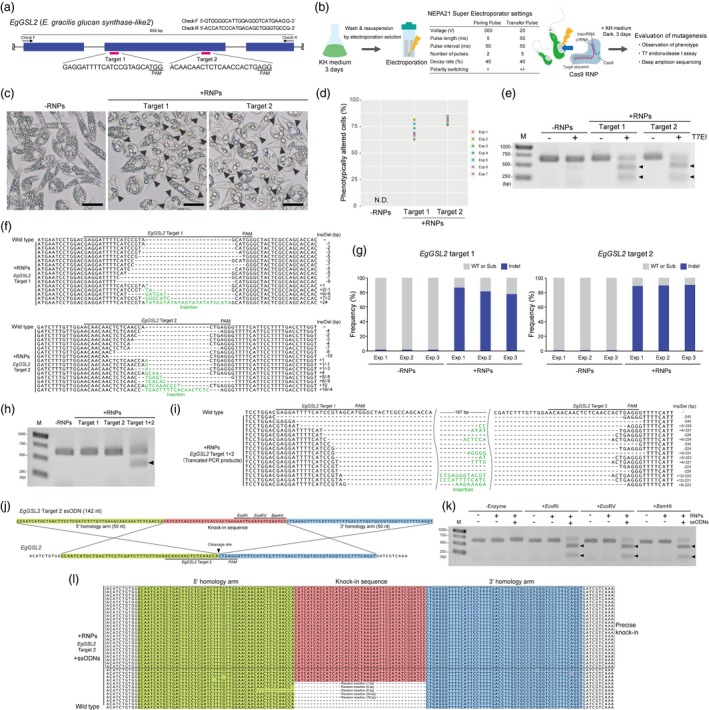
Highly efficient targeted mutagenesis and ssODN‐mediated knock‐in by Cas9 RNPs in Euglena gracilis. (a) Schematic illustration of two targeting sites and primer sequences on the partial genomic sequence of the 5′ end of the EgGSL2 gene. (b) Experimental workflow and settings for electroporation of the targeted mutagenesis methods using Cas9 RNPs in E. gracilis. (c) Representative images of E. gracilis cells untreated with RNP (‐RNPs) and those treated with RNP targeting the EgGSL2 genes at 72 h after electroporation. Scale bars = 25 μm. Arrowheads indicate E. gracilis cells with large paramylon granules. (d) Percentage of phenotypically altered cells at 72 h after electroporation in ‐RNPs and cells treated with RNP targeting the EgGSL2 gene. The graph represents the results of seven independent experiments (Exp. 1–7). N.D., not detected. More than 500 cells were counted for each independent experiment. (e) Detection of mutations at EgGSL2 target sites at 72 h after electroporation by the T7EI assay. M, DNA ladder; arrowheads indicate bands of the digested PCR fragments. (f) Alignment of representative mutation patterns detected in EgGSL2 target 1 (upper) or target 2 (lower) for Cas9 RNP‐treated samples at 72 h after electroporation and the wild‐type EgGSL2 sequence. Ins/Del indicates the number of insertion/deletion bases. (g) Mutation (indel) frequencies of EgGSL2 target 1 (left), target 2 (right) for Cas9 RNP‐treated and nontreated (‐RNPs) samples at 72 h after electroporation estimated by deep amplicon sequencing. Graphs represent the results of three independent experiments (Exp. 1–3) assessed by using the Cas‐Analyzer software (analysis parameters of nuclease type: single nuclease, select nuclease: SpCas9, comparison range: 70, minimum frequency: 0, WT marker range: 5). WT or Sub. indicates wild type or substitution. (h) Detection of the truncated PCR fragment at 72 h after the simultaneous introduction of the targets 1 and 2, in the EgGSL2 gene. M, DNA ladder; arrowheads indicate bands of the truncated PCR product. (i) Alignment of representative mutation patterns in truncated PCR fragments and wild‐type EgGSL2. Ins/Del indicates the number of inserted/deleted bases. (j) Schematic illustration of designed ssODN and EgGSL2 target site 2. (k) Detection of the knock‐in events in the EgGSL2‐targeting site at 72 h after co‐delivery of the EgGSL2 target 2 Cas9 RNPs with ssODNs by restriction fragment length polymorphism. M, DNA ladder; arrowheads indicate bands of the EcoRI‐, EcoRV‐ or BamHI‐digested PCR fragments. (l) Alignment of knock‐in patterns detected in EgGSL2 target 2 Cas9 RNPs and ssODN‐treated samples at 72 h after electroporation and the wild‐type EgGSL2 sequence.
