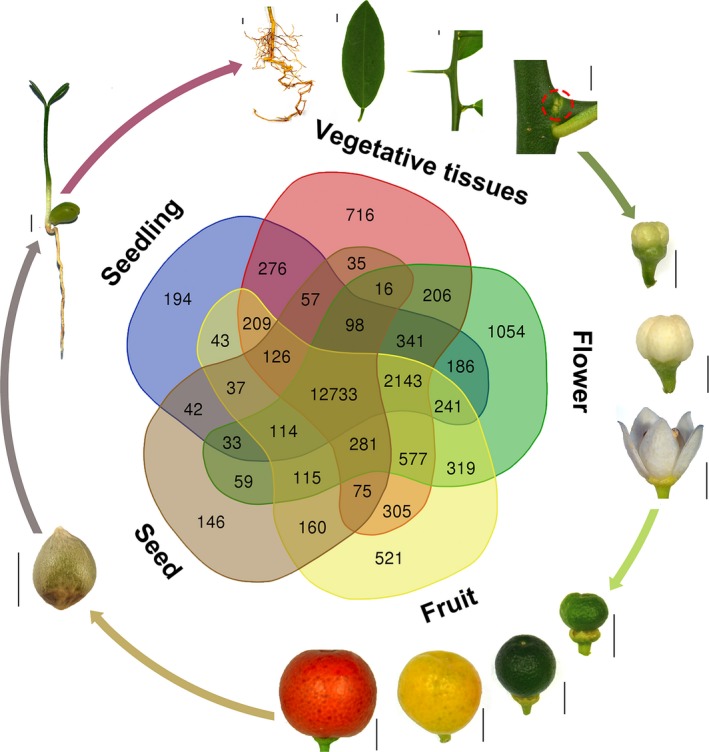
Figure 3.

Life Cycle of F. hindsii and Gene Expression Patterns at Different Developmental Stages. The Venn diagram shows unique and shared gene numbers in the five organs (seed, seedling, adult vegetative, flower and fruit). The outer ring shows the 13 representative tissues used in WGCNA analysis. The red dashed cycle indicates the bud meristem tissue (Bar = 5 mm).
