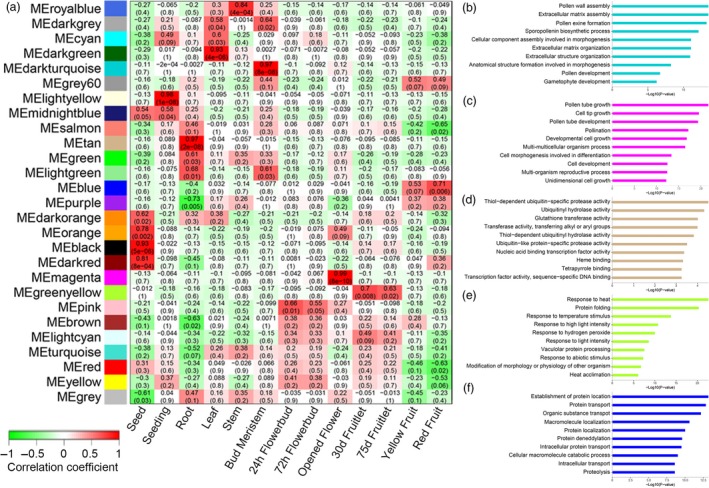
Figure 4.

Detection of Co‐expression Network in Reprehensive Tissues of F. hindsii. (a) Module–tissue association matrix classifies the genes expressed in 13 tissues into 27 co‐expression modules. In the matrix, each row corresponds to a module and each column corresponds to a specific tissue. The colour of each cell at the row–column intersection indicates the correlation coefficient between the module and the tissue. A high degree of correlation between a specific module and the tissue type is indicated by dark red or dark green. (b) to (f) Gene ontology classifications of the genes in MEdarkturquoise, MEmagenta, MEtan, MEgreenyellow and MEblue modules, respectively.
