Figure 1.

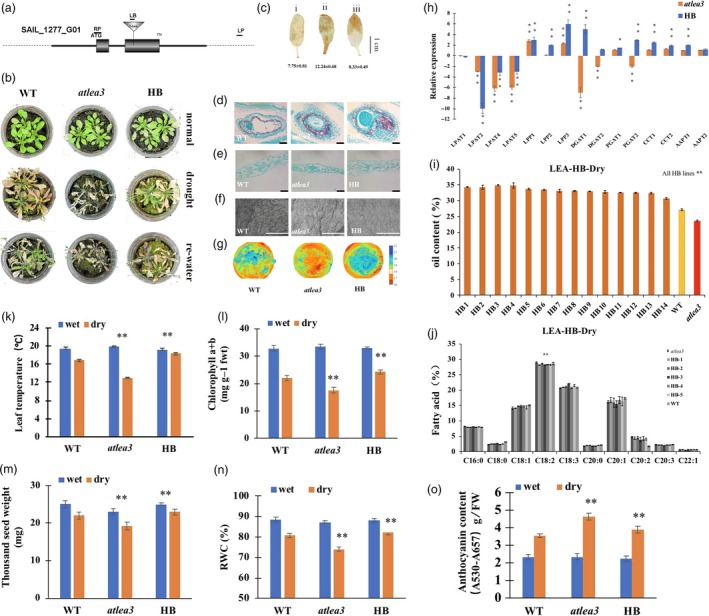
Drought tolerance and oil content of the atlea3 mutant and complementation of the full‐length AtLEA3 gene into atlea3. (a): Schematic diagram of the T‐DNA insertion mutant used in this study (atlea3). (b): Phenotype of the atlea3 mutant, HB (complementary vector transformed into atlea3) and WT under normal, drought and rewatering conditions. (c): DAB staining of WT (i), atlea3 (ii) and HB (iii). The number below indicates the quantitative data of H2O2 content, and unit is nmol/g FW. (d and e): Seed and leaf sections of WT, atlea3 and HB under drought stress. Bar = 500 μm. (f): SEM observation of leaves of WT, atlea3 and HB under drought conditions. Bar = 100 μm. (g): Images of mutant, HB and WT plants in a thermal imaging system under drought conditions. (h): Relative expression levels of genes in the TAG synthetic pathway in HB and atlea3 under drought conditions. LPAT: lysophosphatidic acid acyltransferase, LPP: lipid phosphate phosphatase, DGAT: diacylglycerol acyltransferase, PDAT: phospholipid:diacylglycerol acyl transferase, CCT: choline‐phosphate:CTP cytidylyltransferase, AAPT: aminoalcohol‐phosphotransferase. (i): Oil contents of the HB lines and mutants under drought conditions. (j): FA compositions of the HB lines and mutants under drought conditions. (k–o): Leaf temperatures, chlorophyll a + b contents, RWCs, TSWs and anthocyanin contents of the HB lines and mutants under drought conditions. All the results are represented as the mean ± standard deviation (STD; n = 3). Statistically significant differences were determined using a two‐tailed paired Student's t‐test compared with WT plants under similar conditions, and the results are indicated by **P < 0.01 and *P < 0.05.
