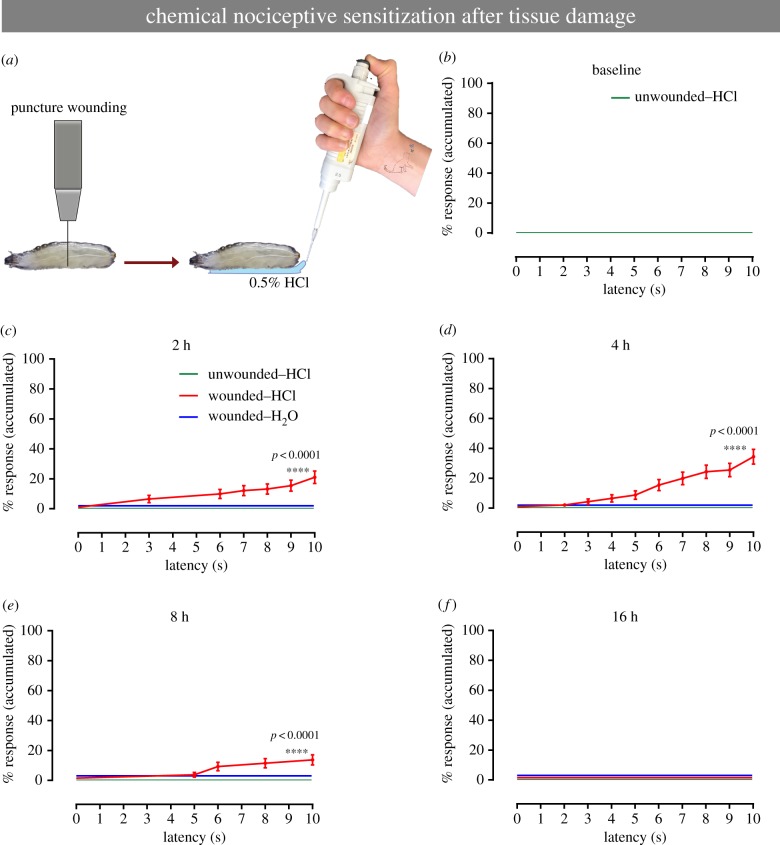
Figure 6.
Chemical sensitization induced by tissue damage. (a) Schematic of chemical sensitization model. After the tissue damage, induced by puncture wound, animals were treated with non-noxious stimulus. (b–f) Behavioural response to non-noxious chemical stimulus (HCl 0.5%). (b) Baseline behavioural response of the animals to a benign solution, MilliQ water. (c–g) Behavioural response of the animals to non-noxious chemical stimulus, at different time points after puncture wounding: (c) 2 h, (d) 4 h, (e) 8 h and (f) 16 h. Colour-coding of groups used in (c) applies for (c–f). (b–f) n = 90 for each group, data from three independent replicates of 30 larvae each. Error bars represent mean ± s.e. Log-rank test was used to determine statistical significance between different groups.

